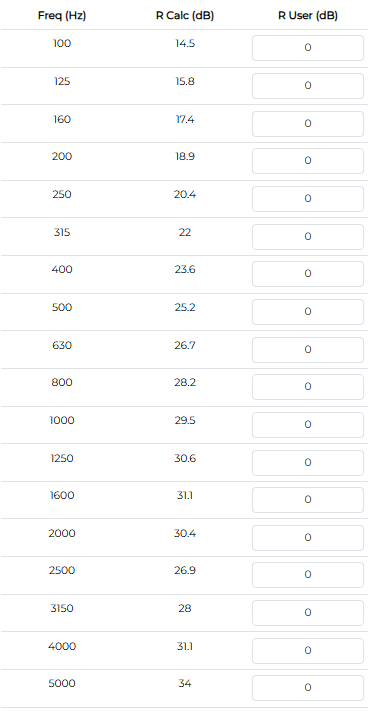
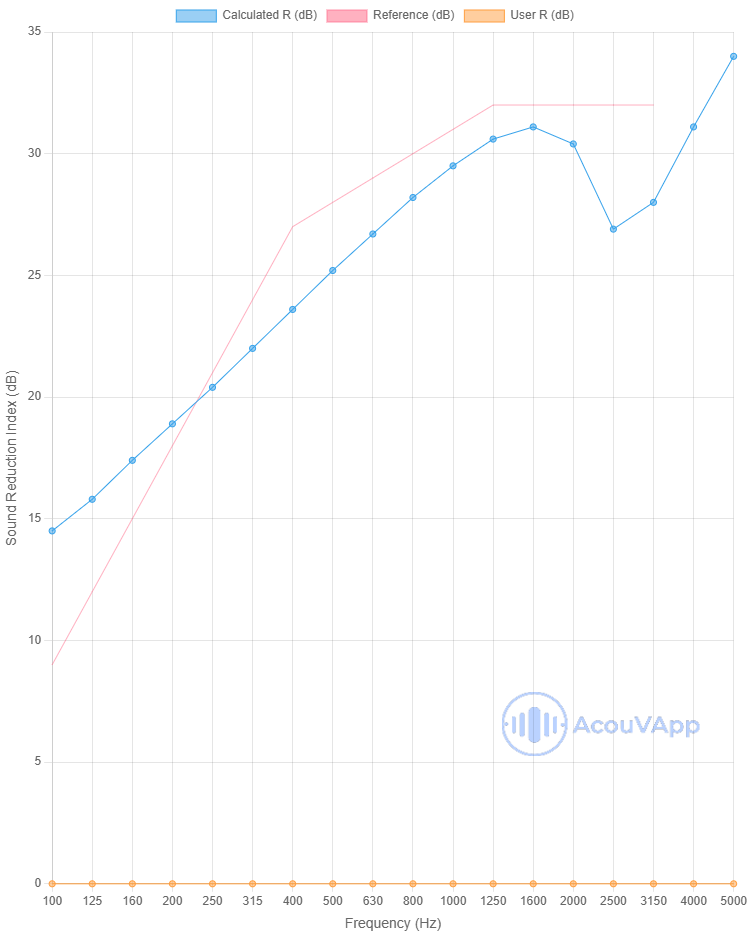
Calculation of the Acoustic Transmission Loss - AcouVApp IsolX
Introduction
AcouVApp IsolX is designed to calculate the acoustic transmission loss of single and double partitions analytically, based on the findings of various research studies and internal R&D efforts.
Acoustic Transmission Loss (TL) measures the effectiveness of a material or structure, like a wall or partition, in reducing the amount of sound energy transmitted through it. This metric is essential for designing soundproofing solutions in buildings, industrial spaces, and other environments where noise control is crucial.
The global formula of the acoustic transmission loss is :
with τ, the tranmssion coefficient, Win, the incident acoustic power and Wout the acoustic power radiated on the other sides of the panel
The objective of AcouVApp IsolX is to propose a comprehensive model (or a combination of models) that consolidates existing knowledge on acoustic insulation calculation, thereby assisting acousticians in their daily practice and to offer an educationnal tools easily accessible.
The next sections provide a detailed description of the theoretical foundations underlying the models, along with comparisons between calculated results and experimental measurements. Where appropriate, a brief discussion of potential improvements to the models is included. Input data for the calculations are presented alongside the resulting curves and have been sourced from material databases or estimated based on measurements.
Readers are encouraged to compare their data with the provided calculations and to reach out for further discussion and insights.
It is important to note that this model forms part of a more extensive framework developed by Impulsion Acoustique for research and development purposes. For detailed calculations tailored to your specific products, do not hesitate to contact us.
Theory of the models used in the calculation of the transmission loss of single and double wall
Single Wall Model (SWM)
The acoustic performance of materials (thin and isotropic) depends on the frequency of the sound wave relative to the material's critical frequency (fc). The following zones highlight how sound behaves across different frequency ranges:
- Zone 1: Below the Critical Frequency
In this zone, the mass law governs transmission loss. Materials with higher mass density and thickness provide better soundproofing.
In the this frequency range, the transmission loss increases of 6dB by doubling the frequency. Doubling the mass follows tha same law (+6dB).
- Zone 2: Around the Critical Frequency
In this transition zone, the damping factor and the critical frequency significantly influence transmission loss. Material properties, such as elasticity and internal friction, become critical in this range.
- Zone 3: Above the Critical Frequency
For frequencies higher than 1.2fc, transmission loss increases by approximately 9dB per octave. This zone is dominated by the material's damping factor. Materials engineered with high damping properties, such as viscoelastic composites, are particularly effective in this range.
- Zone 4: Above the limit of the thin plate theory
frequency
For frequencies higher than 4 times the frequencie of the thin plate theory, dilatationnal in the thickness appears that reduces the transmission loss. In many building or transportation materials (thin materials with bending modes only), these frequencies appear outside the frequencies ranges of interest (more than 5000Hz). But for thick material like concrete or blocks, these frequencies could be around 2000-3000Hz.
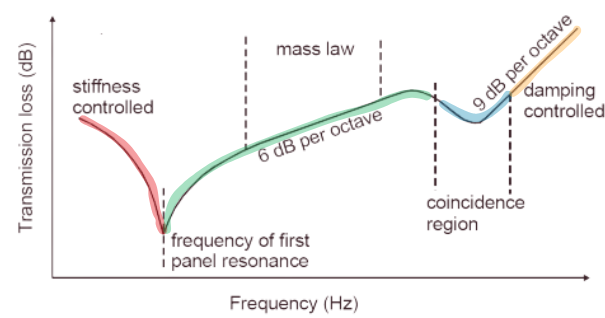
In AcouVApp IsolX, mainly the models use different theory developed last decades:
- The acoustic insulation is calculated using the models developed by Davy [1] for frequencies below the critical frequency. This approach accounts for the finite dimensions of the panel, unlike models assuming infinite panels. For frequencies above the critical frequency, the method proposed by Sharp [2] is used. This combined strategy aligns with the findings of Kosala [3], who concluded that this combination offers one of the most accurate results when comparing calculations to measurements.
- The model proposes also the possibility to add more than one layer (Multilayer Model). In [4] from Mansilla, they proposed to calculate and equivalent model of the different layers to perform the calculations. This model is only valid for spot laminated multilayers (screws or spot of glue and not glued on the total surface.) This approach works well for material quite close in term of characteristics (with closed critical frequencies) but could have more uncertainties when using materials very different.
- In high frequency where the thin plate theory (resonance in the thickness), a limitation is calculated based on calculations from Hopkins [5]. Indeed, for thick materials (like concrete), a reduction of the sound transmission loss appears due to thickness resonances at a frequencies higher than 6 times the thin frequency limit.
The current implementation does not account for orthotropic materials (materials with varying stiffness in different directions), which is under development. Additionally, composite materials (e.g., laminated systems with two panels and a soft core) are not yet supported. Furthermore, the first mode of vibration is not included in the calculations.
Double Wall Model (DWM)
A double wall is composed on 2 single walls (or multilayers) separated by a cavity that can be with or without absorption (airbone path). These 2 walls are connected by structural links (structure borne path).
For the transmission loss of a double wall, different frequencies ranges are important as show on the pictures:
- Before the mass-air-mass resonance (f0), the mass is coupled
- At the resonance frequency f0, the transmission loss decreased as the resonance between the mass coupled air cavity that play the role of spring.
- After the resonance, the mass is discoupled and the transmission loss increased up to 18dB/oct.
- In the higher part of this region, the structural links and absorbing material has an important effect.
- In the case of thin plate, the transmission loss decreased due to the different critical frequencies and it’s modulated by the damping of the plates.
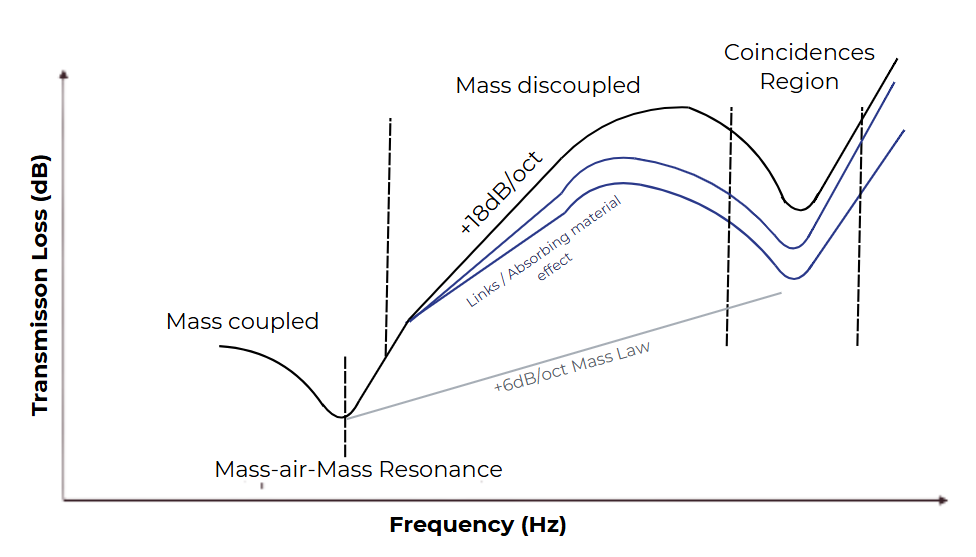
For the double wall model, different theories have been used as the transmission loss can divided in 2 parts : The airborne and structureborne path.
- For airborne path, models developped by Davy
[6][1]
are used. These
models describe the airborne behaviour along all the frequencies range below the
mass-air-mass
resonance frequency (f0) to above the last crirical frequency (fc2). This model has been
used in
many studies from the author [7] and other [8]. In these papers, Davy proposes an approach
by
calculating the transmission loss separately in three zones :
- Below the f0, where the panels behave like a single wall
- Between f0 and below the critical frequencies taking into account or not also the absorbing material inside the cavity
- At and above critical frequencies, this frequency range is dependant of the damping loss factor of the different panels
- For structure path, Davy’model [15] is used.
Indeed,
different studies
has been done to evaluate the transmission loss due to the links and the compliance (inverse
of the
stiffness) of the links. In our models, we use the line and points models [15] to calculate
the
transmission from the links.
The calculation integrates also the compliance (that is frequency dependent) of the studs based on the works of Davy and al [14 ]16]. The compliances are estimated from double wall measurements by substracting the airborne path from the total and inverting the studs transmission loss loss to evaluate the corresponding compliance. The compliance of the studs depends of the studs spacing, the studs thickness, the total mass and the depth of the studs. In the simple model (line and points), the links are considered as rigid (Cm=0).
At the end, the 2 transmission coefficients (airborne + structureborne) are summed to have the final transmission loss values.
- Some remarks about the model :
- As for the SWM, the multilayer approach is based on Lin [11] that also calculates an equivalent model. The limitation is the same than the SWM.
- From Rindel [12], the damping loss factor is a combinaison of the internal damping, the border damping (the connexion of the wall with surrondings) and damping from the radiation
- The mass-air-mass resonance takes into account the presence of absorption in the cavity (isothermal or adiabatic)
- Currently the absorption in the cavity is set to maximum 1 with a frequency curve depending of the depth of the cavity ([3]). As proposed in [3], for an empty cavity, the absorption is not set to 0 but a constant value depending of the cavity depth is added. A next version will include the air resisitivty to calculate the absorption with the possibility to change the material inside the cavity (thickness and absorption)
- The studs compliance proposed in the model is an average of all calculations done by with some uncertainties. Moreover, the compliance is calculated on a base of US studs that could be different from other countries. So when some correlations are done take it into account and do not to hesitate to change the input data.
- Another important effect not in the model, it’s the case where links are very stiff. In this case, the mass-air-mass resonance could change due to the coupling with drum modes between 2 links. This phenomenon could appear with wood studs or thick steel studs. See [17]
Applications of Acoustic Transmission Loss
Understanding the transmission loss behavior of materials and systems is crucial for:
- Building Design: Ensuring walls, floors, and ceilings meet noise control standards in residential, commercial, and industrial spaces.
- Product Development: Designing materials with tailored acoustic properties for maximum sound insulation.
- Regulatory Compliance: Meeting industry noise reduction standards for health and safety.
Acoustic Transmission Loss Global Index Calculation
The calculations of Rw, Rw+C and Rw+Ctr follow the ISO 717-1 standard and provides single-number quantities for airborne sound insulation in the frequency range of 100-3150Hz.
Sound Transmission Class (or STC) is an integer rating of how well a building partition attenuates airborne sound. In the US, it is widely used to rate interior partitions, ceilings, floors, doors, windows and exterior wall configurations. The calculation follows the ASTM E413
Learn More about acoustic
For further insights into acoustic performance and soundproofing solutions, explore the module to calculate the critical frequency or browse our acoustic product database to have an overview of acoustic performances of real products.
This calculation is provide for information, we are not responsible of possible damages if you use the results
Comparison between experimental and calculations results of the acoustic transmission loss
Single Wall
Concrete 200mm
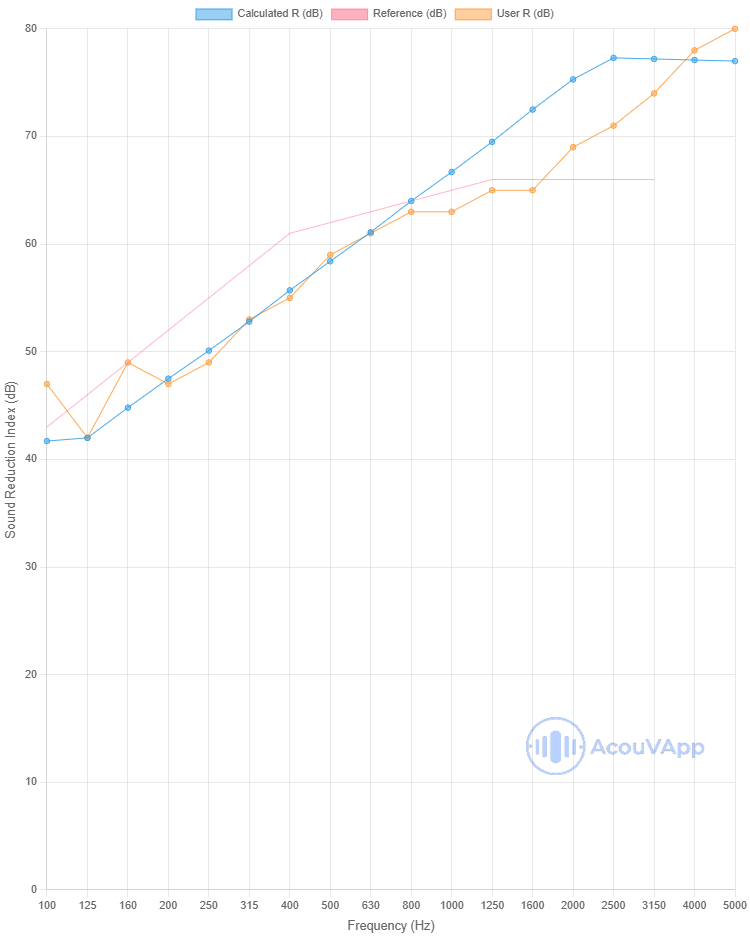
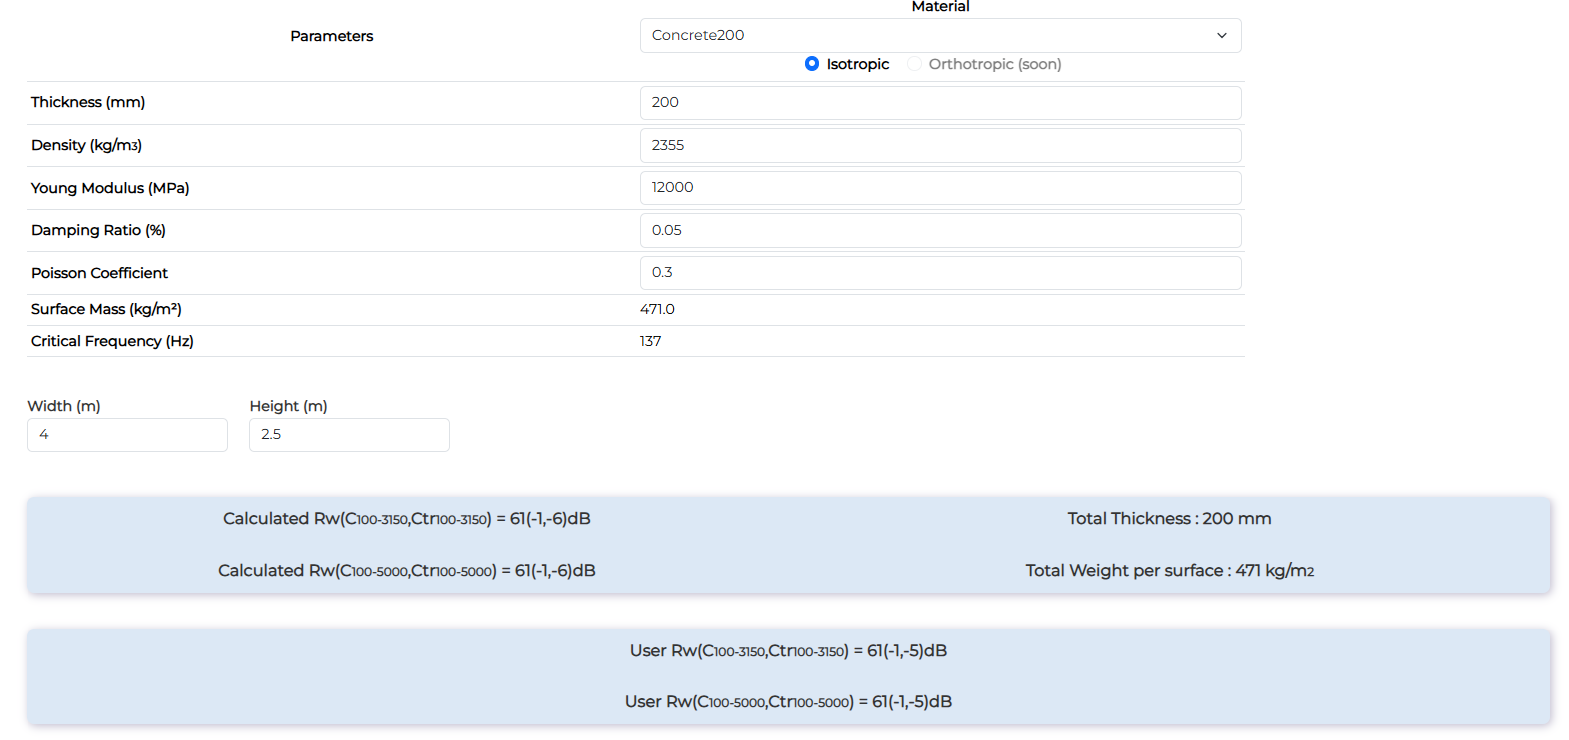
| Concrete 200mm | Rw (dB) | Rw+C (dB) | Rw+Ctr (dB) |
| Measurement | 61 | 60 | 56 |
| Calculation | 61 | 60 | 55 |
Concrete 140mm
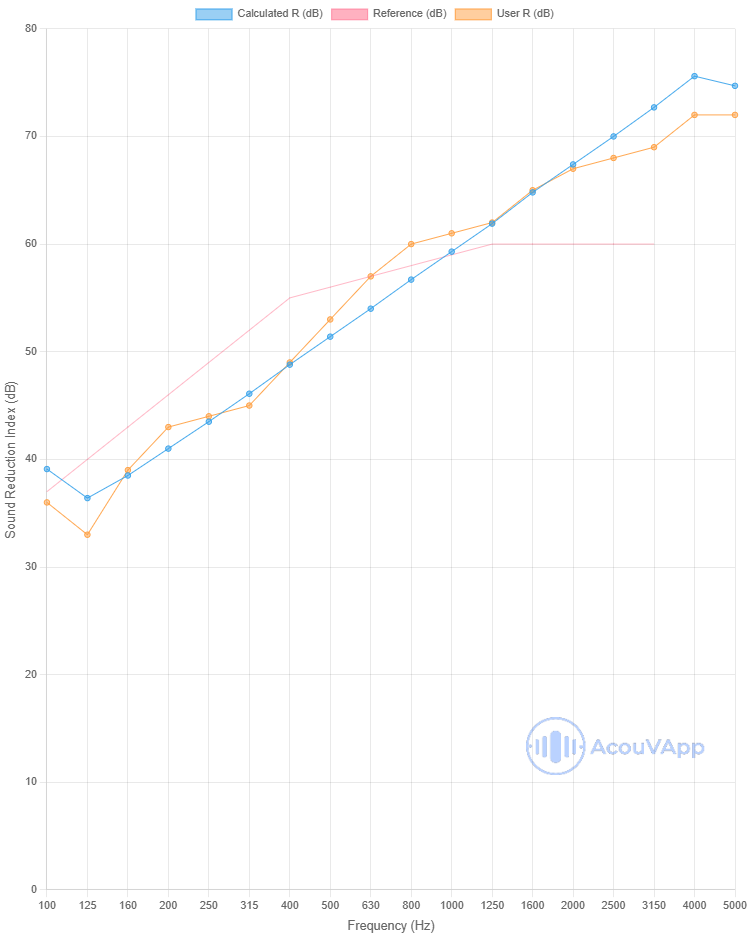
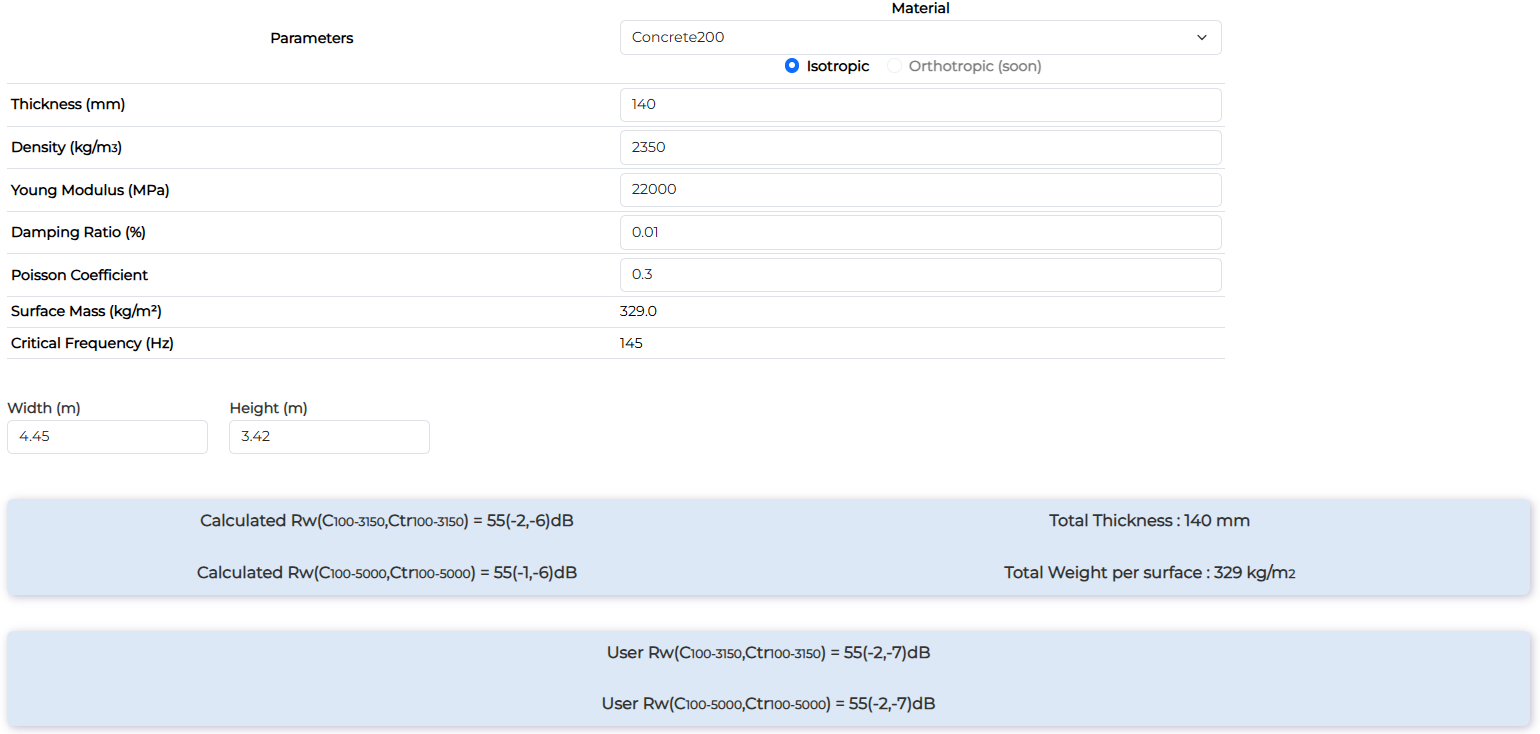
| Concrete 140mm | Rw (dB) | Rw+C (dB) | Rw+Ctr (dB) |
| Measurement | 55 | 53 | 48 |
| Calculation | 55 | 53 | 49 |
Hollow Concrete 215mm
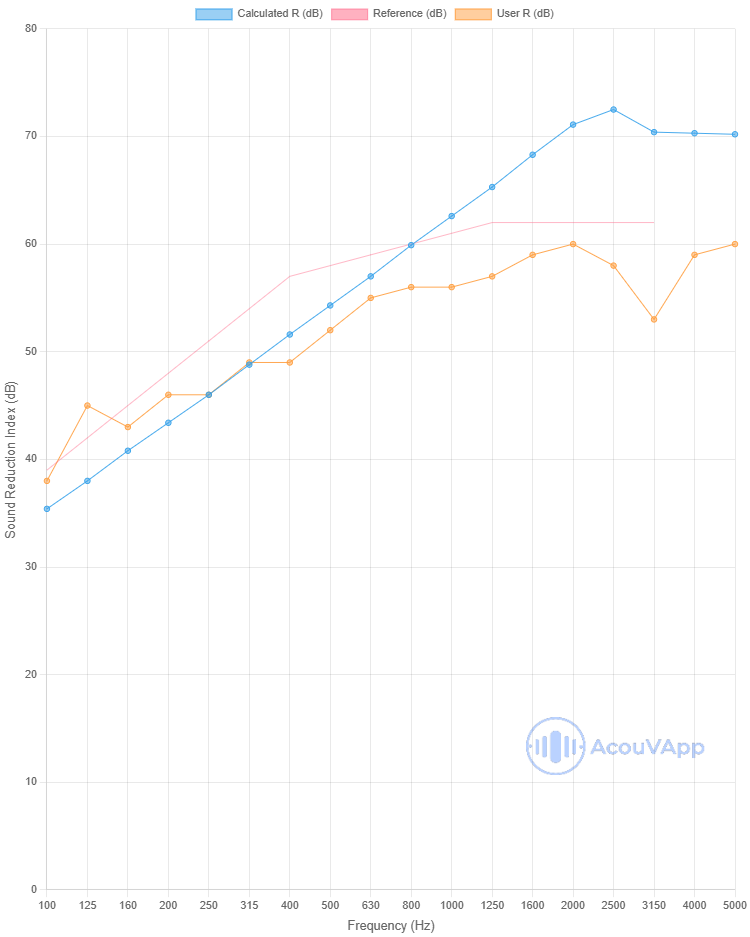
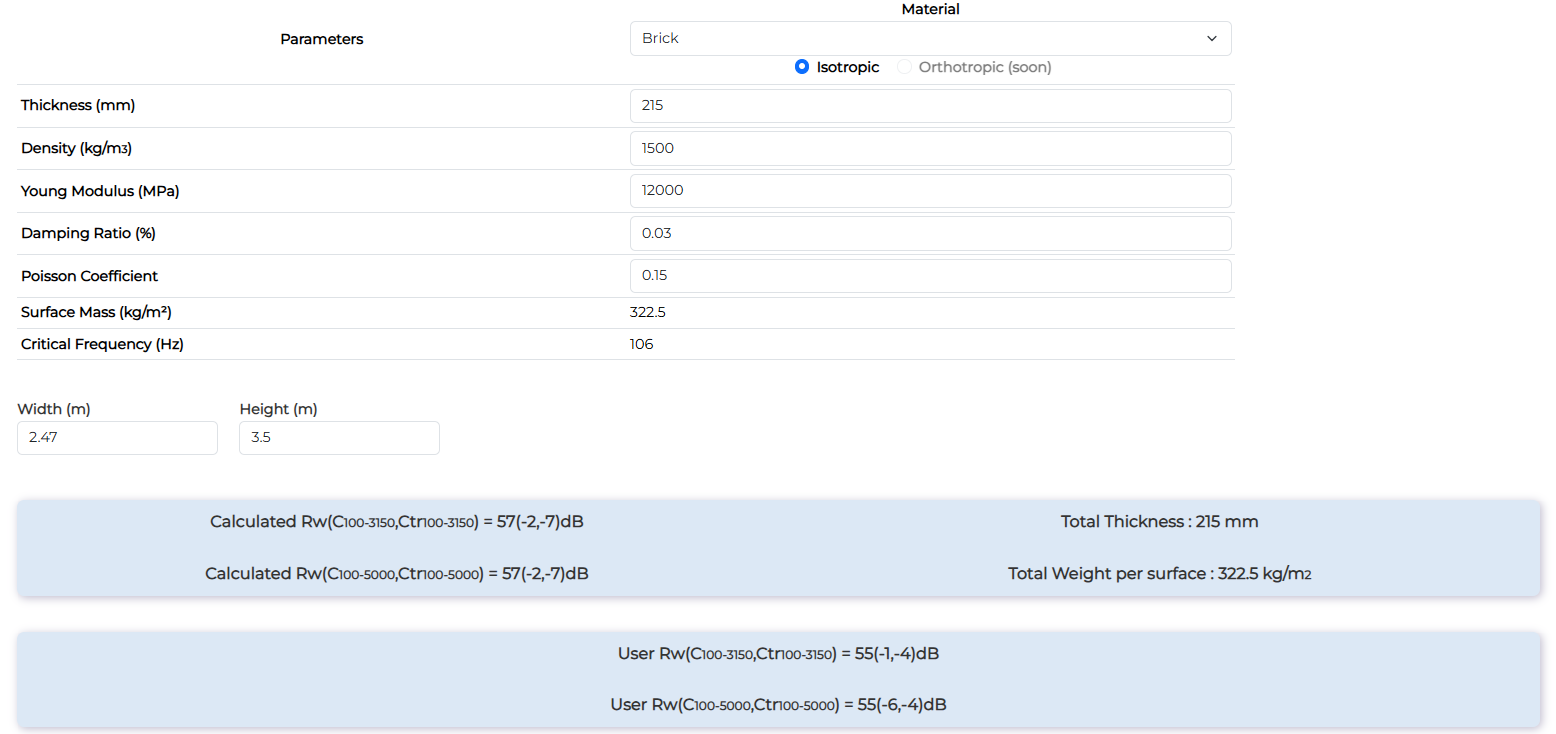
| Hollow Concrete 215mm | Rw (dB) | Rw+C (dB) | Rw+Ctr (dB) |
| Measurement | 55 | 54 | 51 |
| Calculation | 57 | 55 | 50 |
The global value is quite well calculated as it depends strongly of the low-mid frequency performances. For this material, some differences appear in high frequency probably due to some resonances not taken into account in the model. Moreover in low frequency, some dips are present probably due to orthotropic behaviour of this kind of product.
Ceramic Hollow Brick Block 250mm
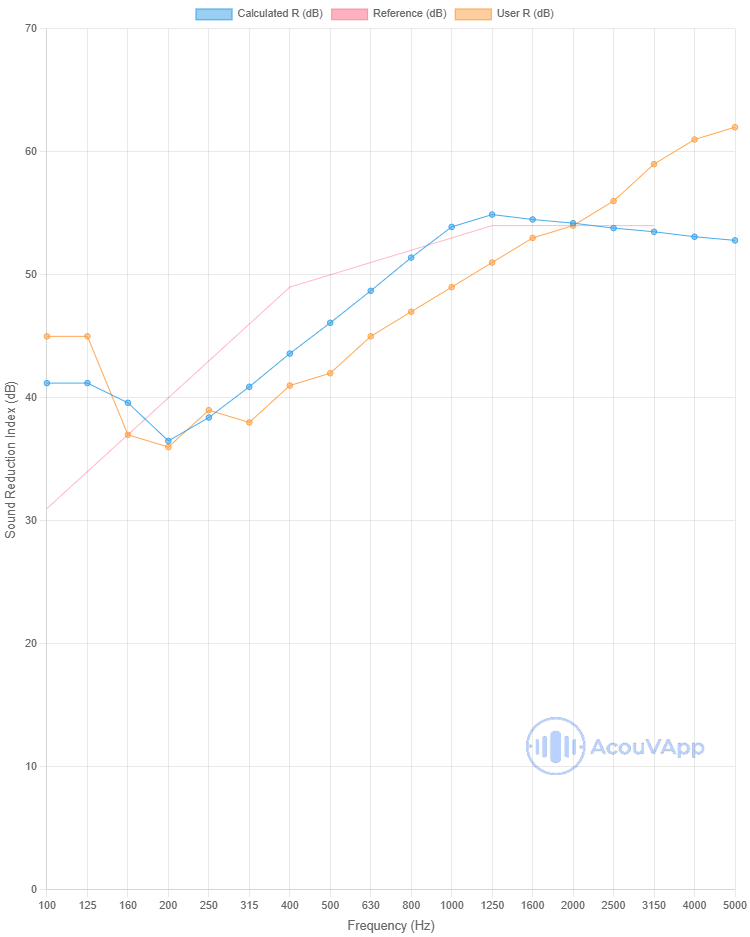
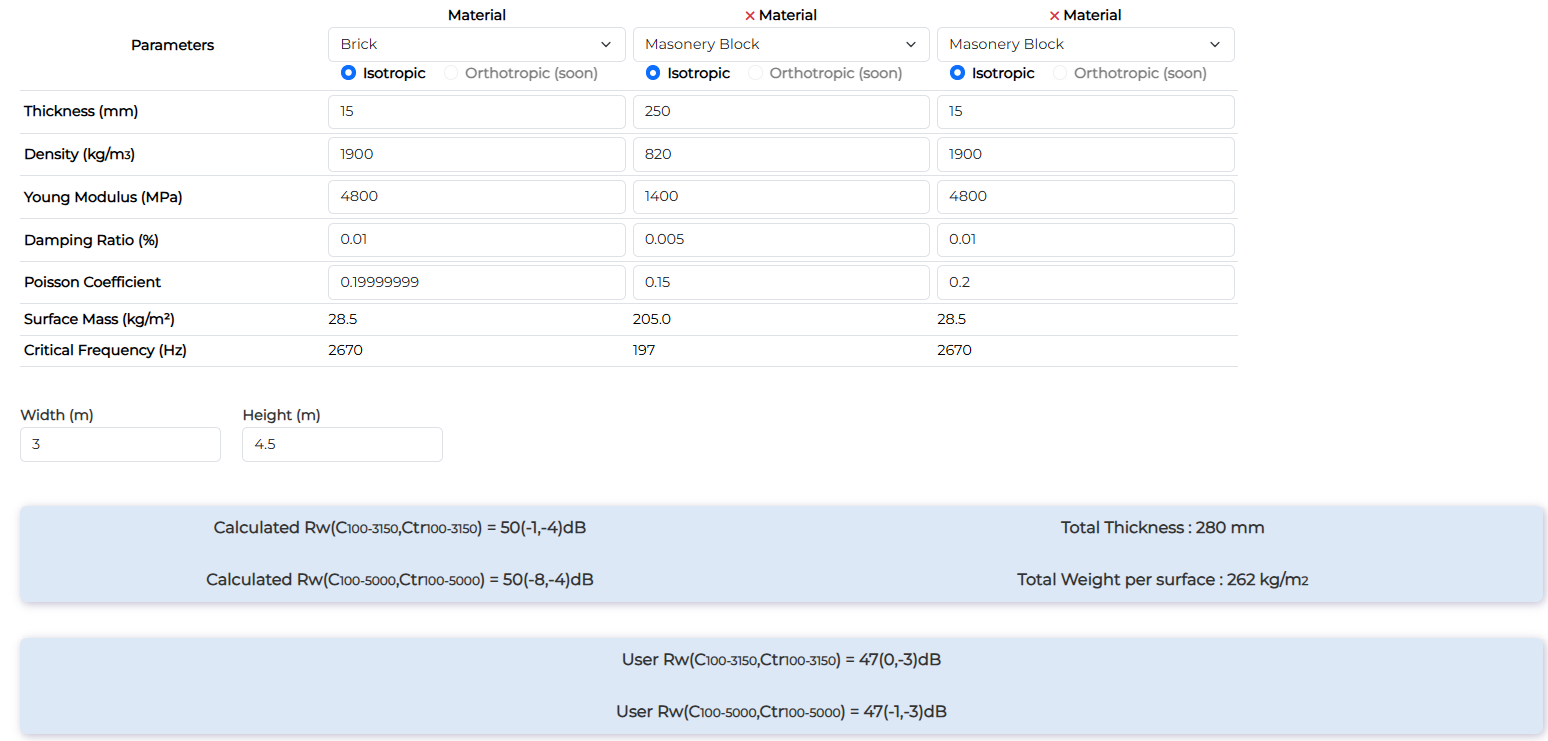
| Ceramic Hollow Brick Block 250mm | Rw (dB) | Rw+C (dB) | Rw+Ctr (dB) |
| Measurement | 47 | 47 | 44 |
| Calculation | 50 | 49 | 46 |
In low frequency, some dips are present probably due to orthotropic behaviour of this kind of product. In high frequency, some investigations are needed.
Drywall 6.4mm
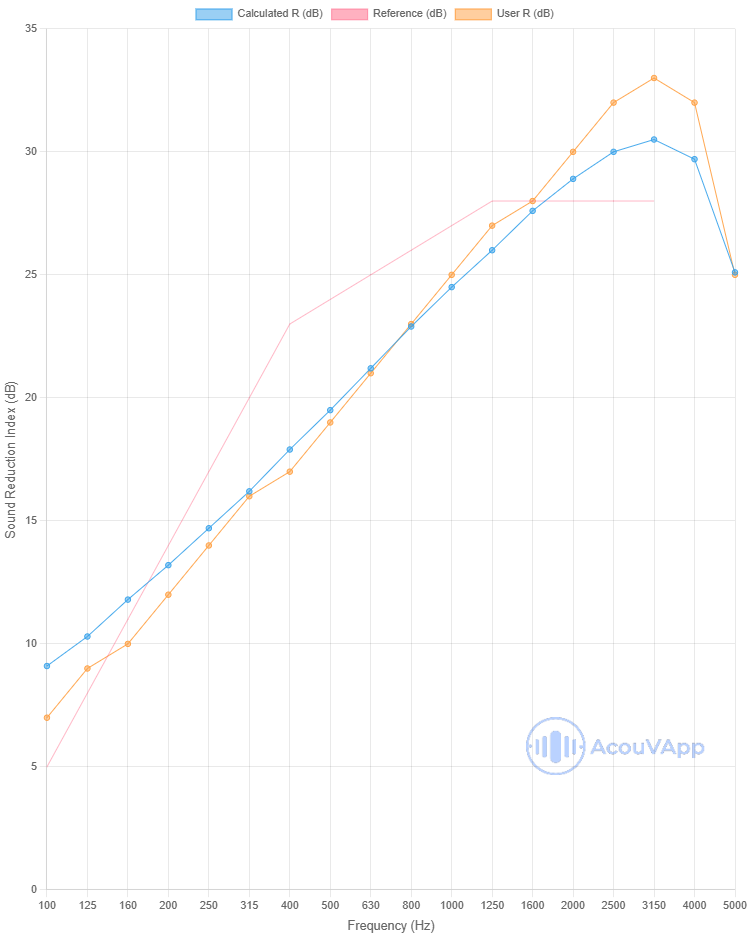
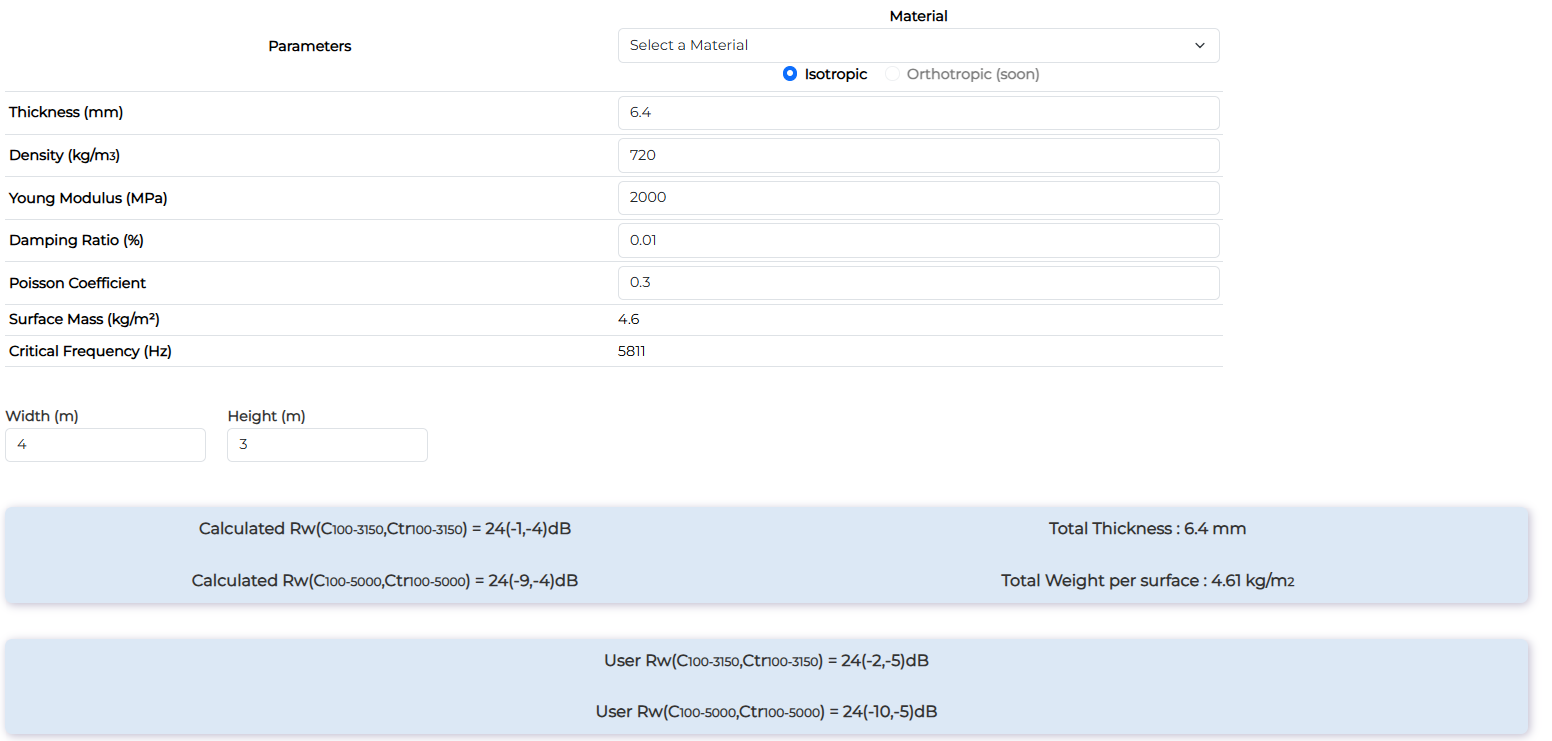
| Drywall 6.4mm | Rw (dB) | Rw+C (dB) | Rw+Ctr (dB) |
| Measurement | 24 | 22 | 19 |
| Calculation | 24 | 23 | 20 |
Drywall 12.7mm
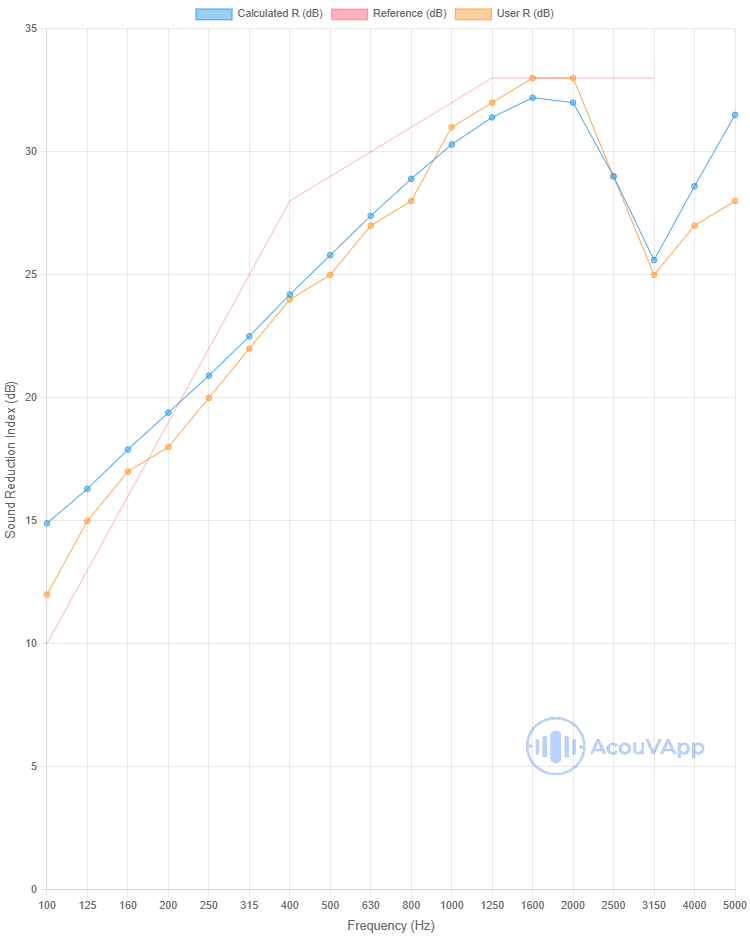
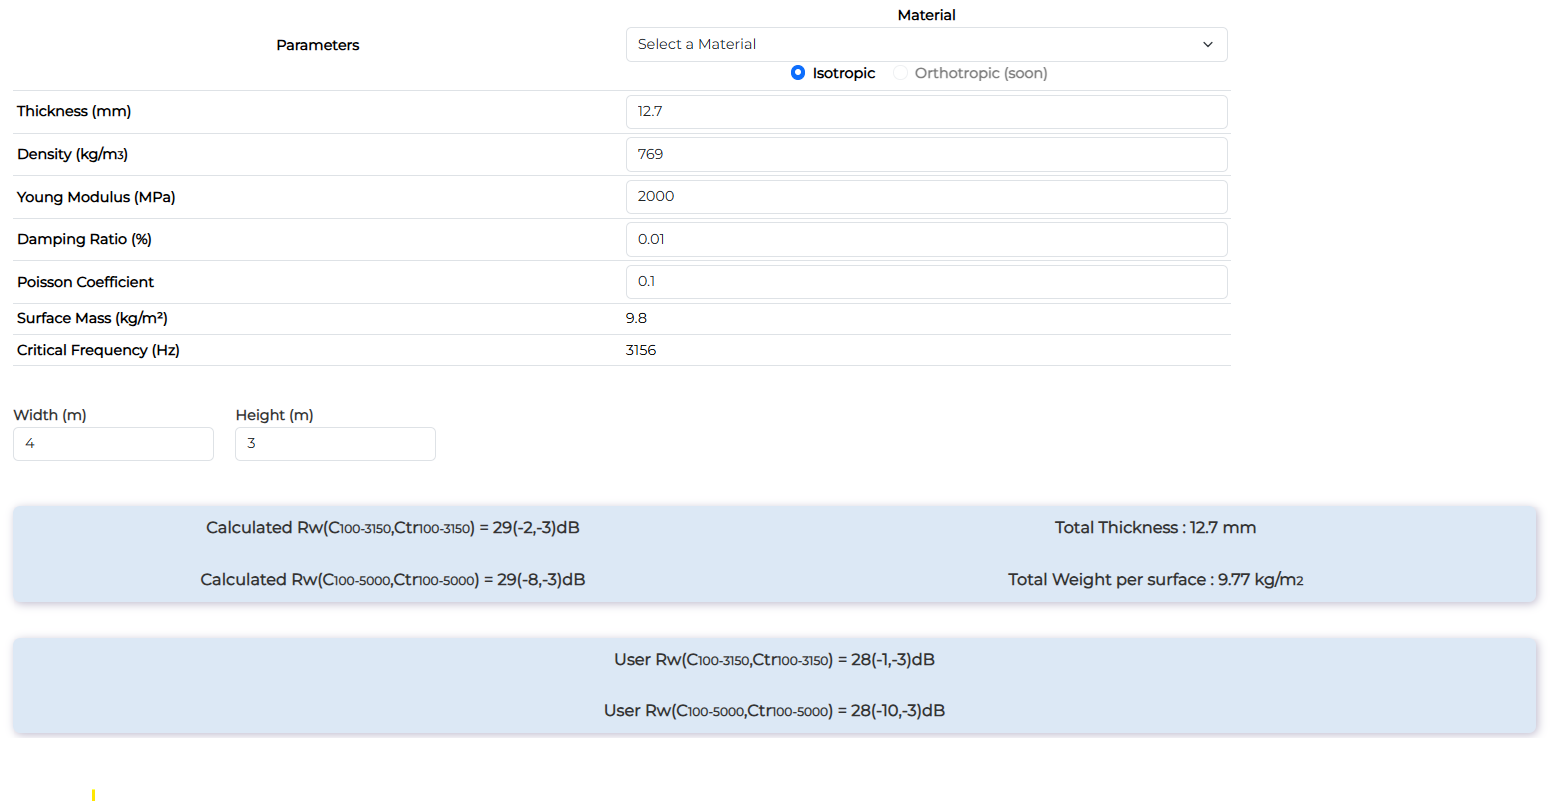
| Drywall 12.7mm | Rw (dB) | Rw+C (dB) | Rw+Ctr (dB) |
| Measurement | 28 | 27 | 25 |
| Calculation | 29 | 27 | 26 |
Drywall 12.7mm + 12.7mm
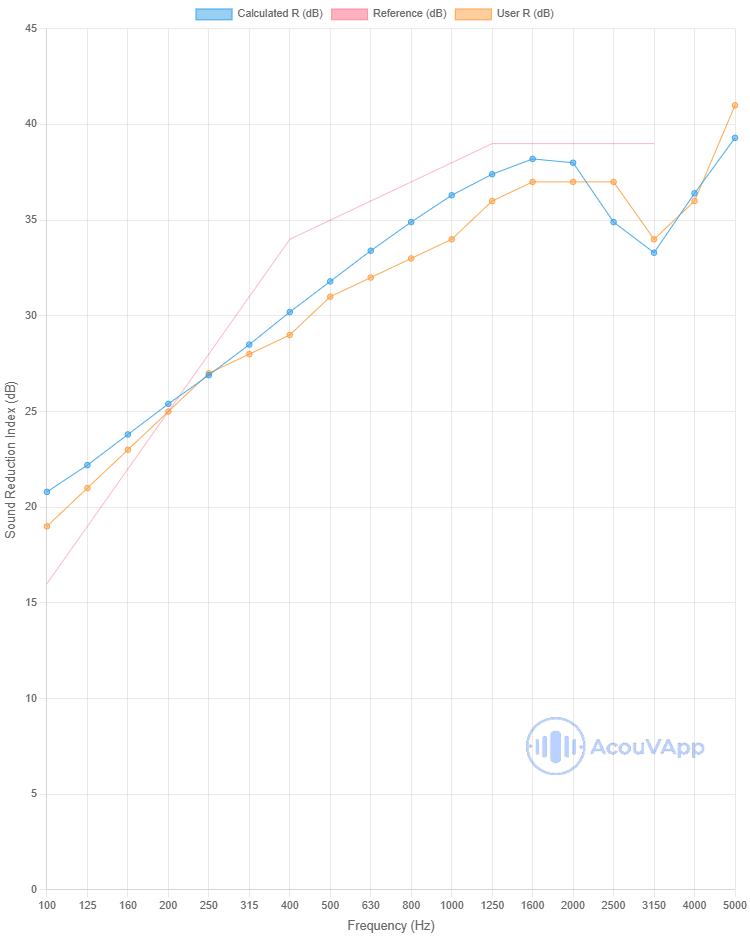
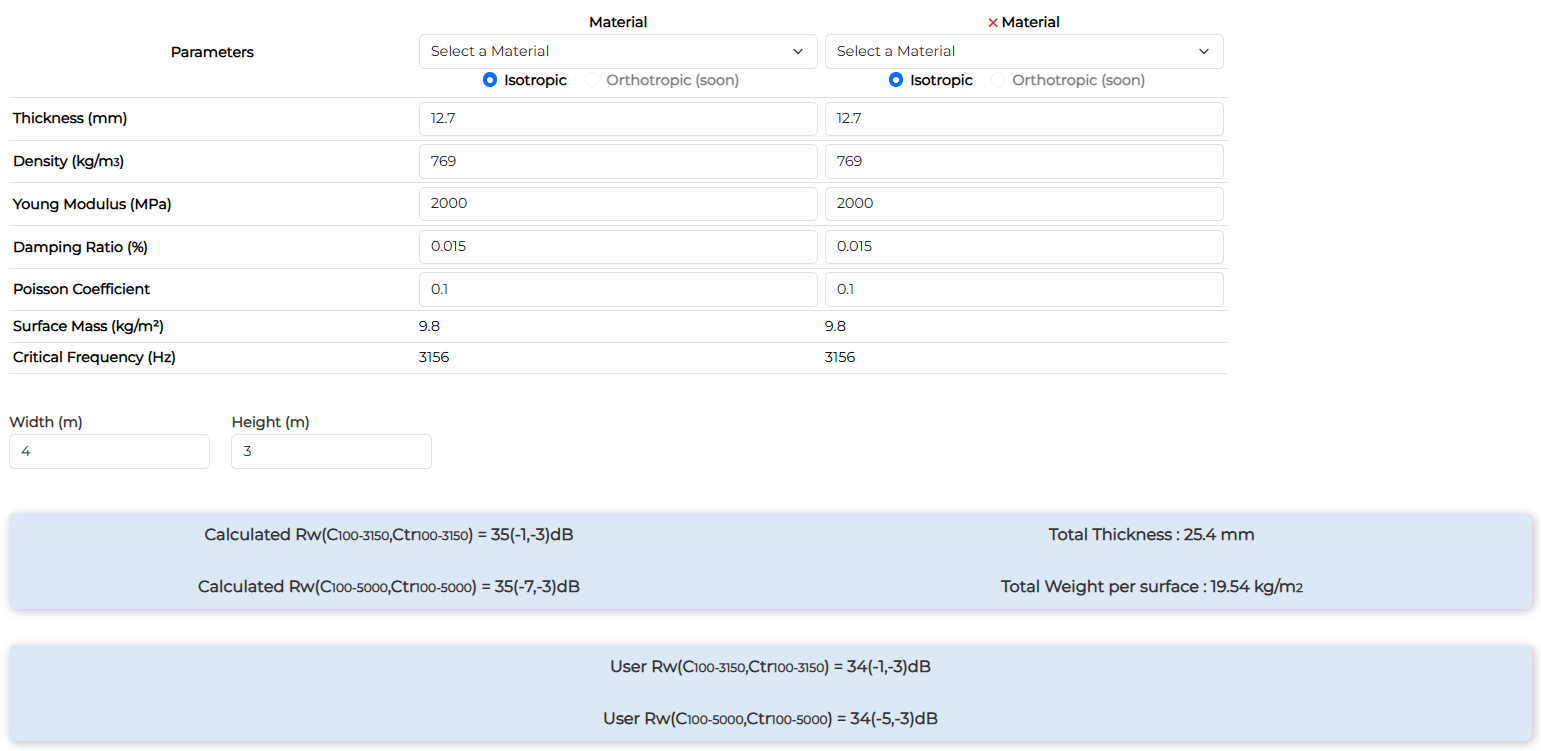
| Drywall 12.7mm + 12.7mm | Rw (dB) | Rw+C (dB) | Rw+Ctr (dB) |
| Measurement | 34 | 33 | 31 |
| Calculation | 35 | 34 | 32 |
Double Wall
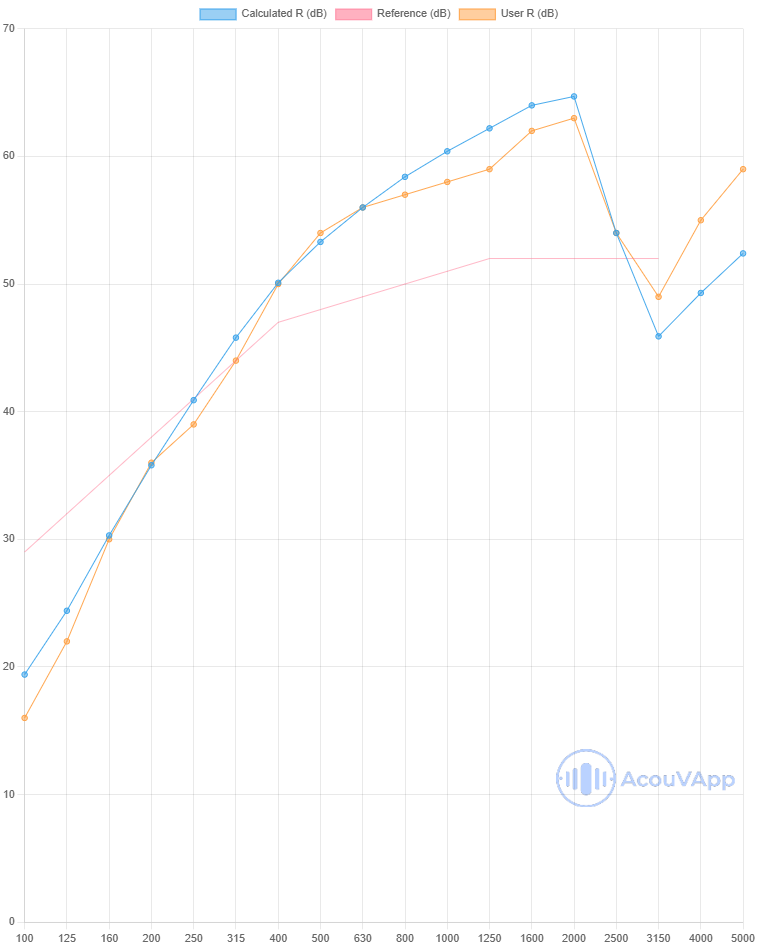
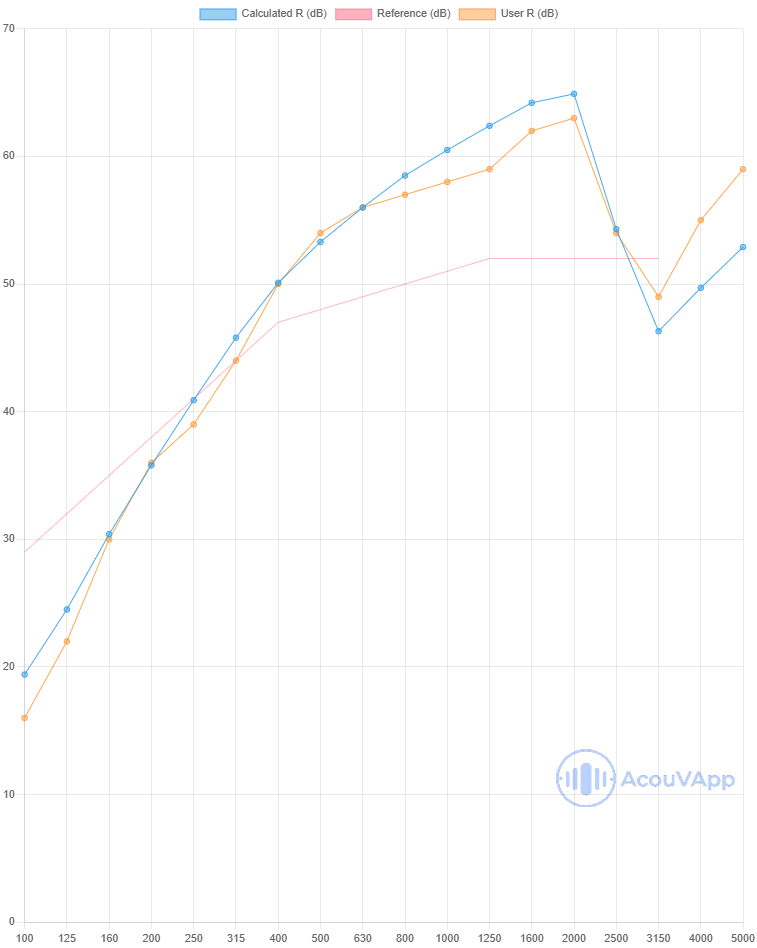
72mm partition - 12.5mm plasterboard both sides with 45mm biomaterial wool
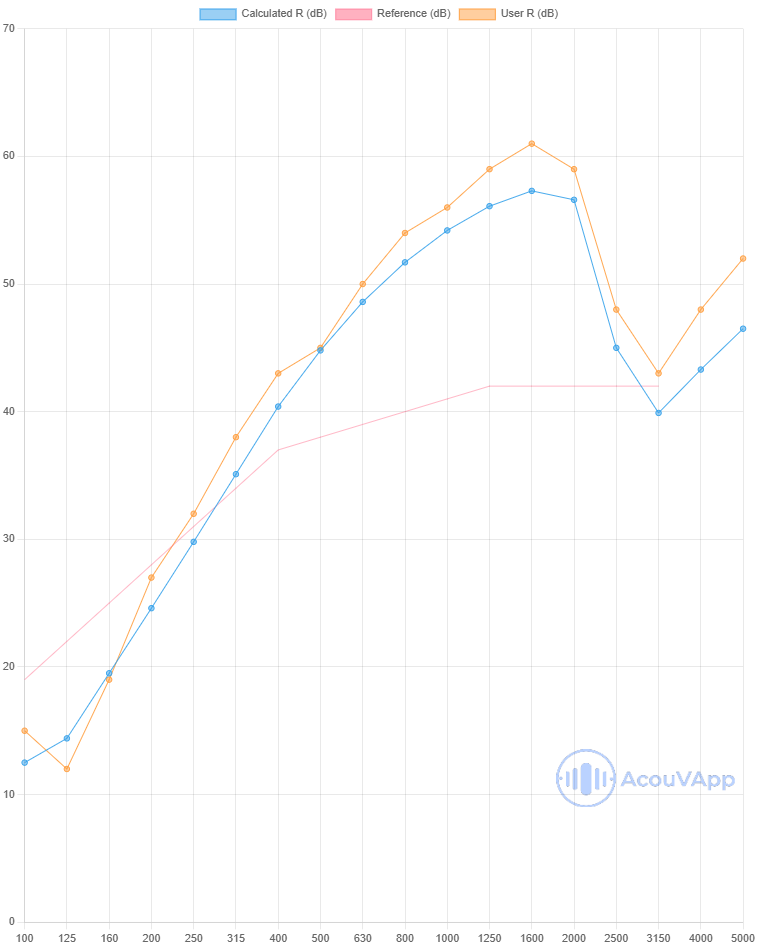
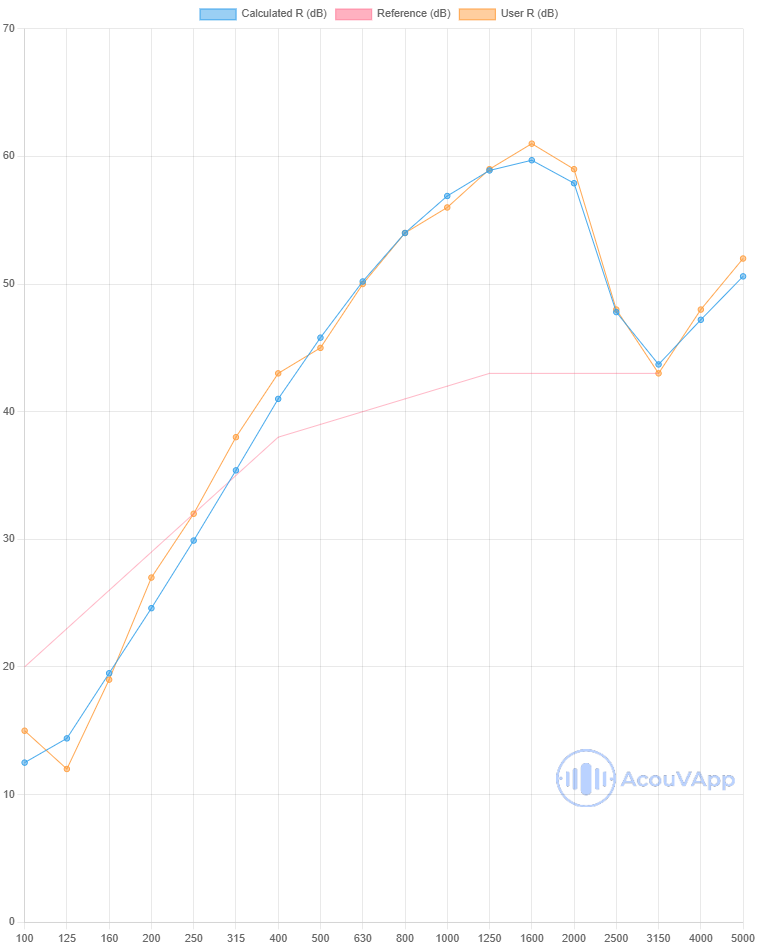
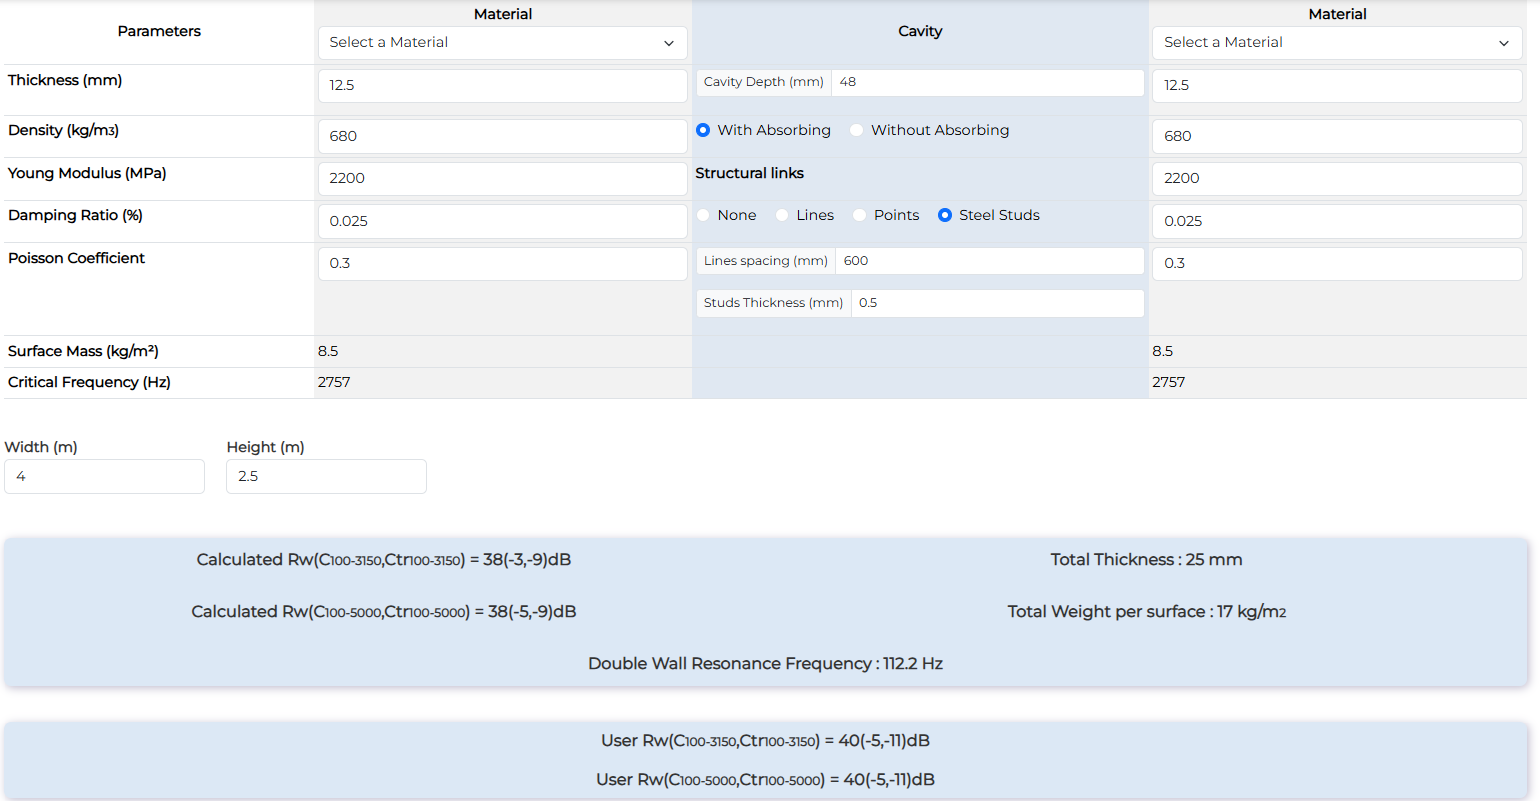
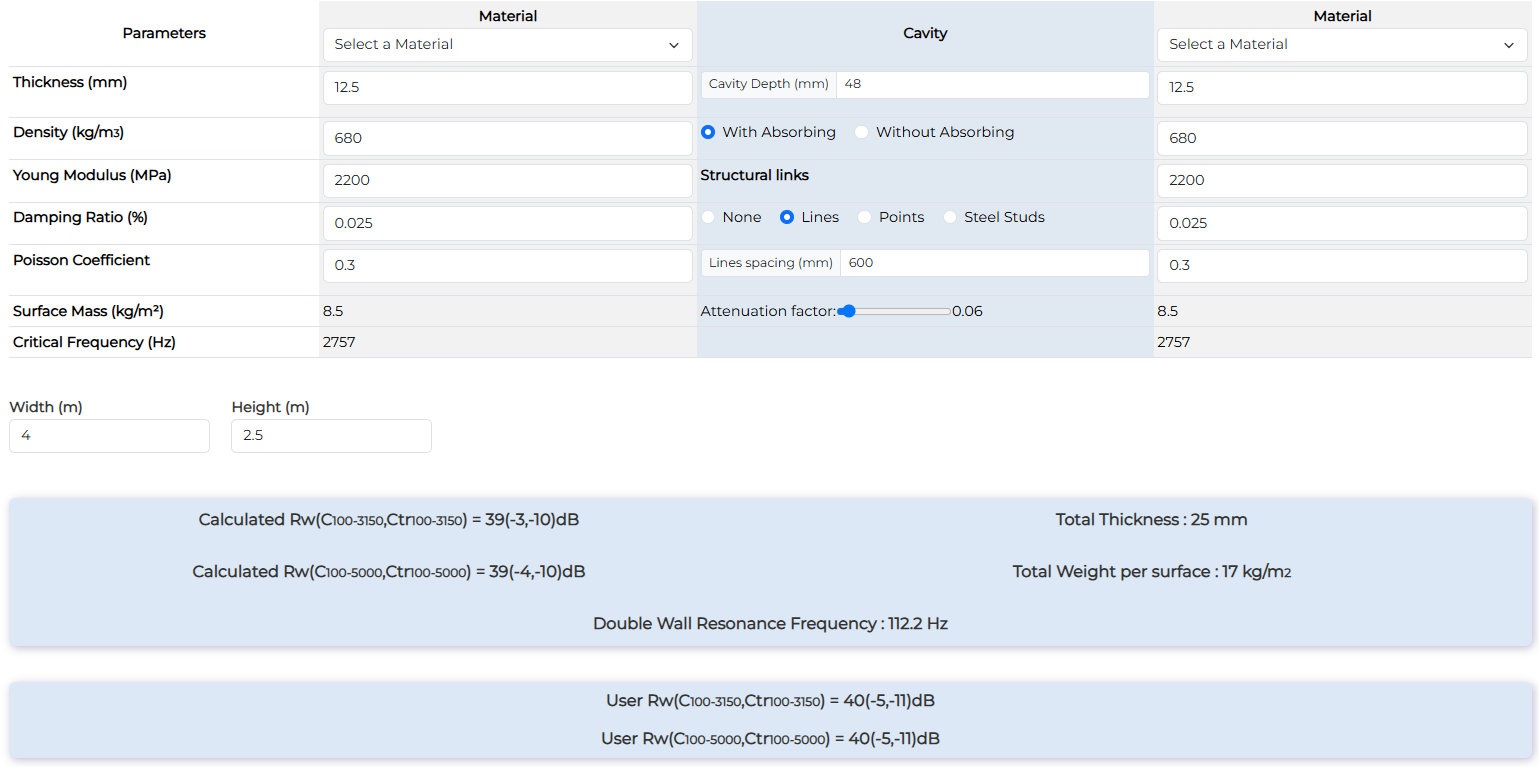
| 72mm partition - 12.5mm plasterboard both sides with 45mm biomaterial wool | Rw (dB) | Rw+C (dB) | Rw+Ctr (dB) |
| Measurement | 40 | 35 | 29 |
| Calculation with studs | 38 | 35 | 29 |
| Calculation with lines | 39 | 36 | 29 |
98mm partition - 2 x 12.5mm plasterboard both sides with 45mm biomaterial wool
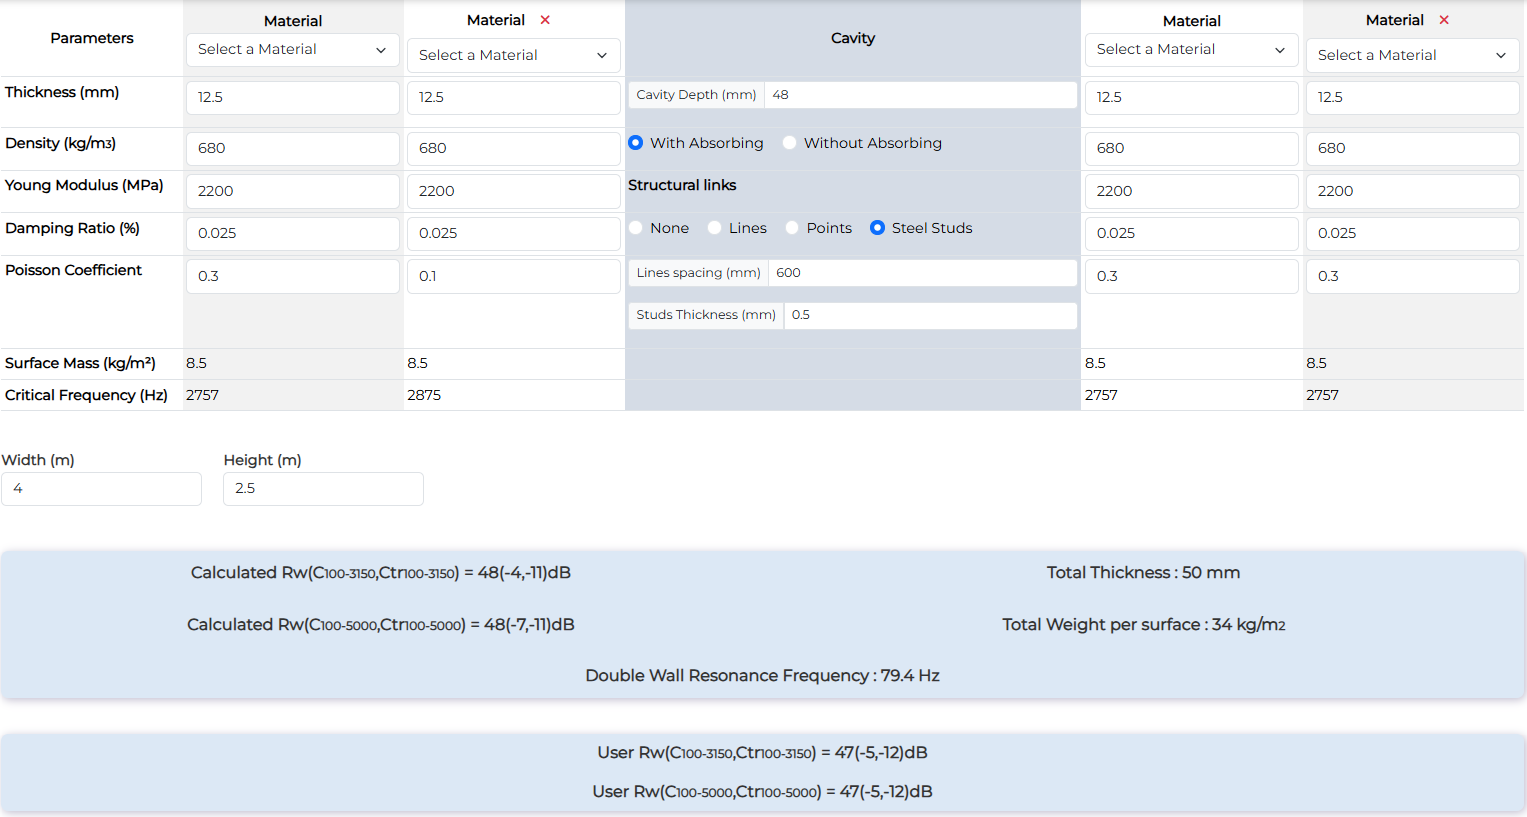
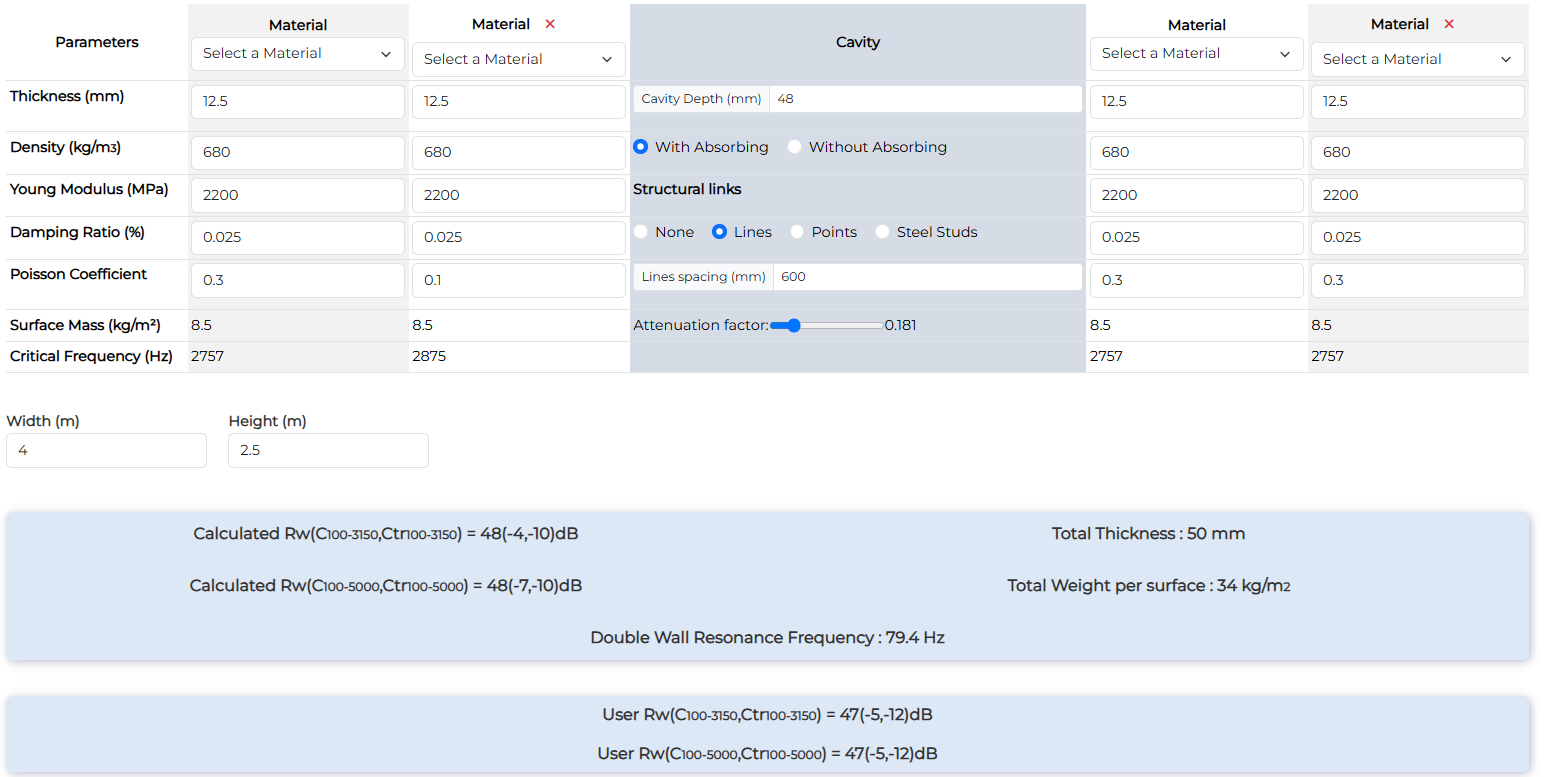
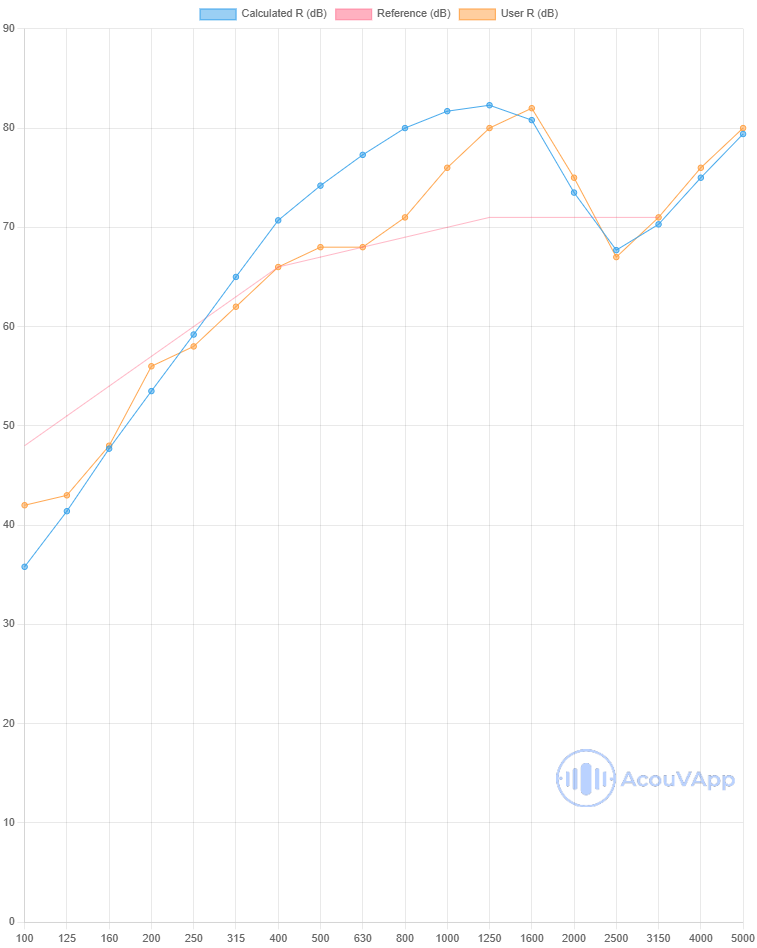
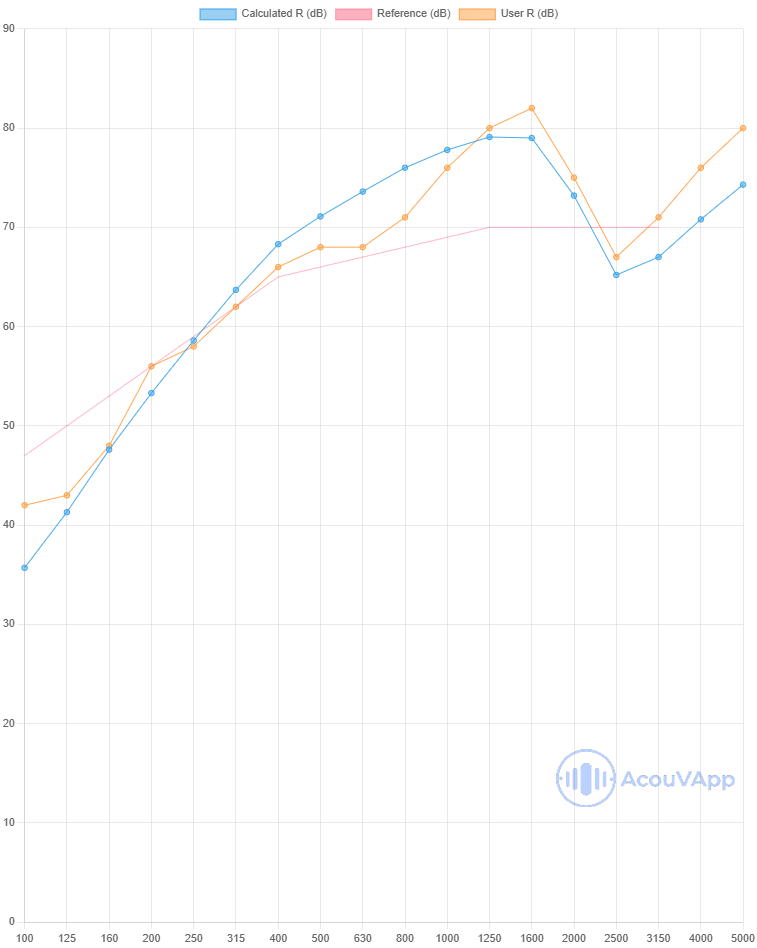
| 98mm partition - 2 x 12.5mm plasterboard both sides with 45mm biomaterial wool | Rw (dB) | Rw+C (dB) | Rw+Ctr (dB) |
| Measurement | 47 | 42 | 35 |
| Calculation with studs | 48 | 44 | 37 |
| Calculation with lines | 48 | 44 | 38 |
This calculation is interesting because with an uncertainty of 2dB, the extrapolation from the calculation of the 72mm partition works well (no adaptation only add the materials).
200mm Separative - 2 x 15mm with 50mm absorbing material in 140mm cavity
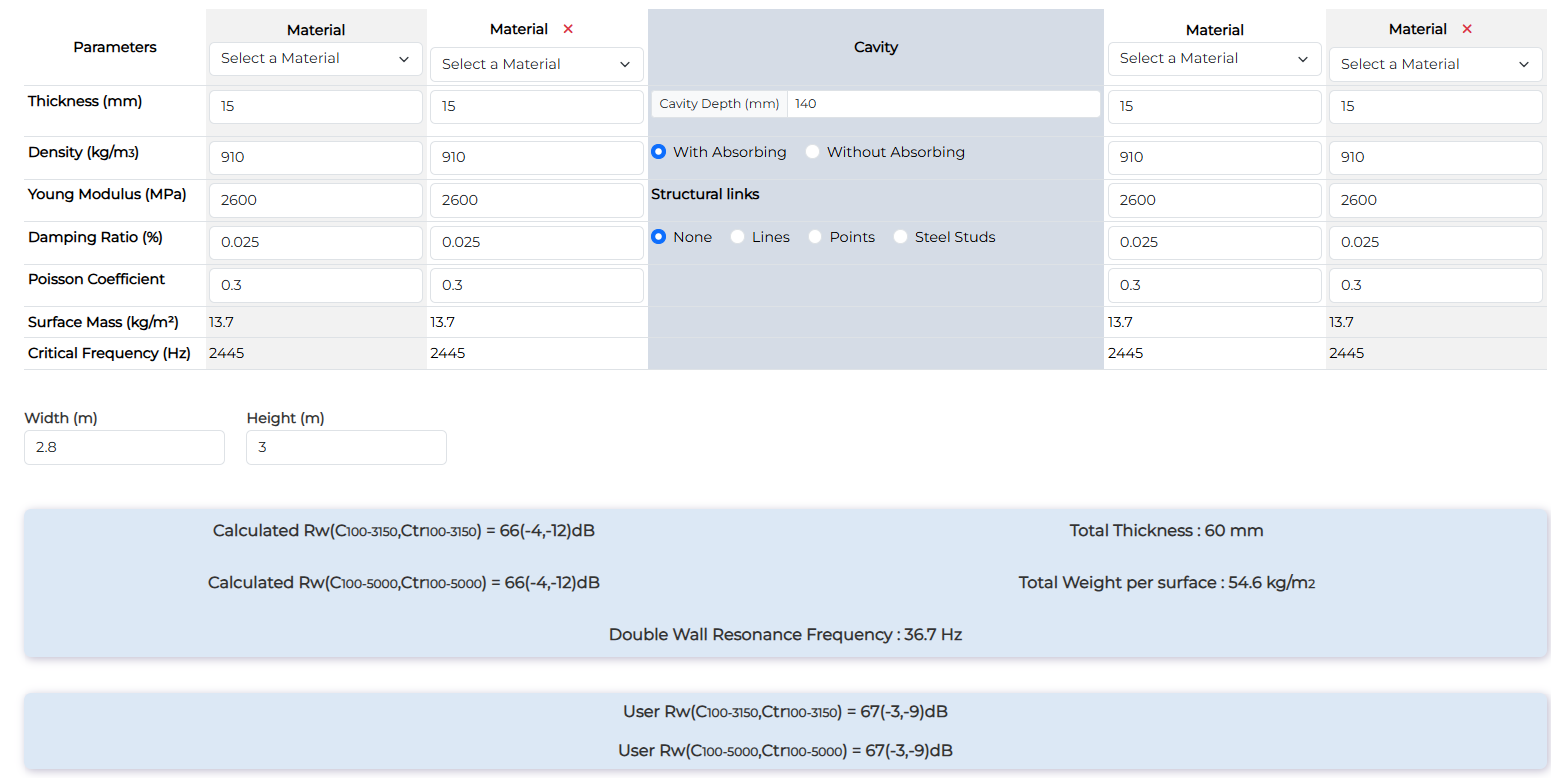
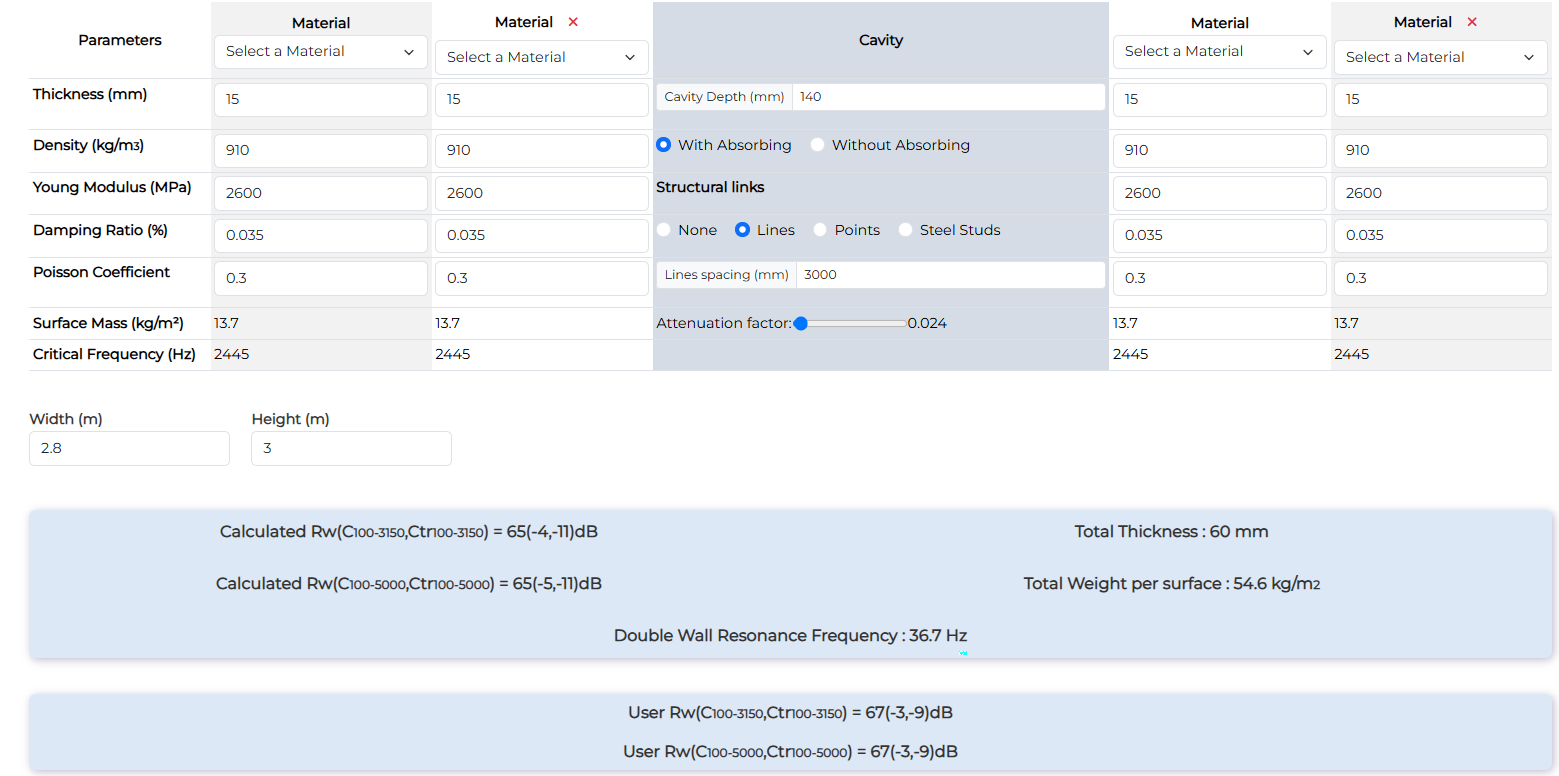
| 200mm Separative - 2 x 15mm with 50mm absorbing material in 140mm cavity | Rw (dB) | Rw+C (dB) | Rw+Ctr(dB) |
| Measurement | 67 | 64 | 58 |
| Calculation with no links | 65 | 61 | 54 |
| Calculation with lines | 66 | 62 | 54 |
In this calculations, some differences are present in low frequencies. Low frequency are often the frequency range with more uncertainties due to modal behaviour of the room, the plate and the mounting of the panel.
Wood floor with ceiling + 2 plasterboard 13mm
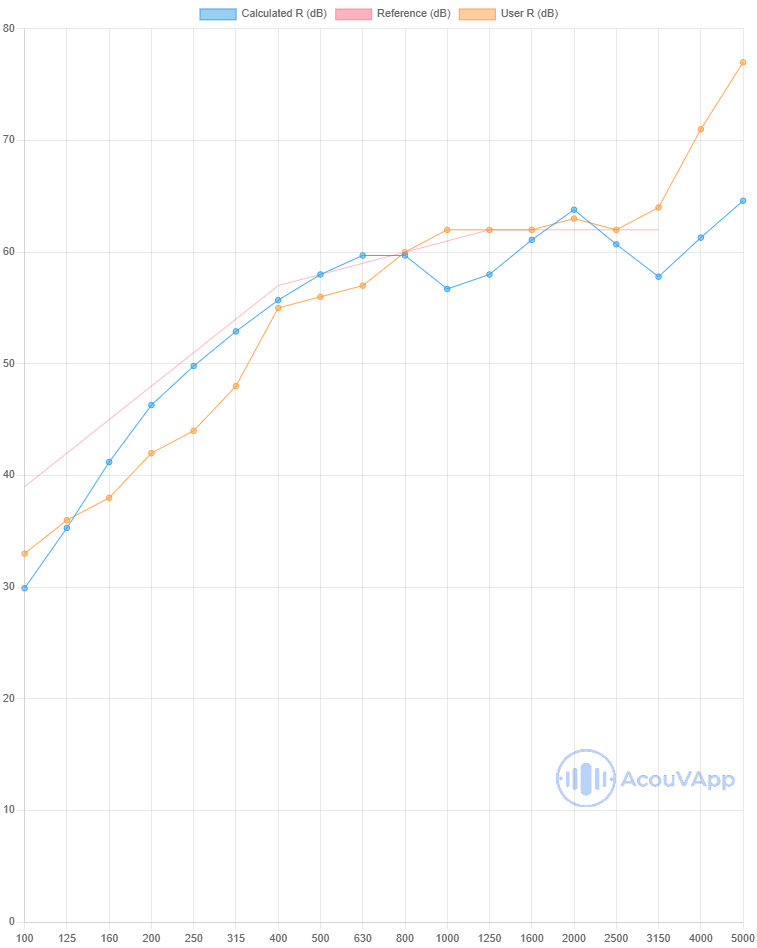
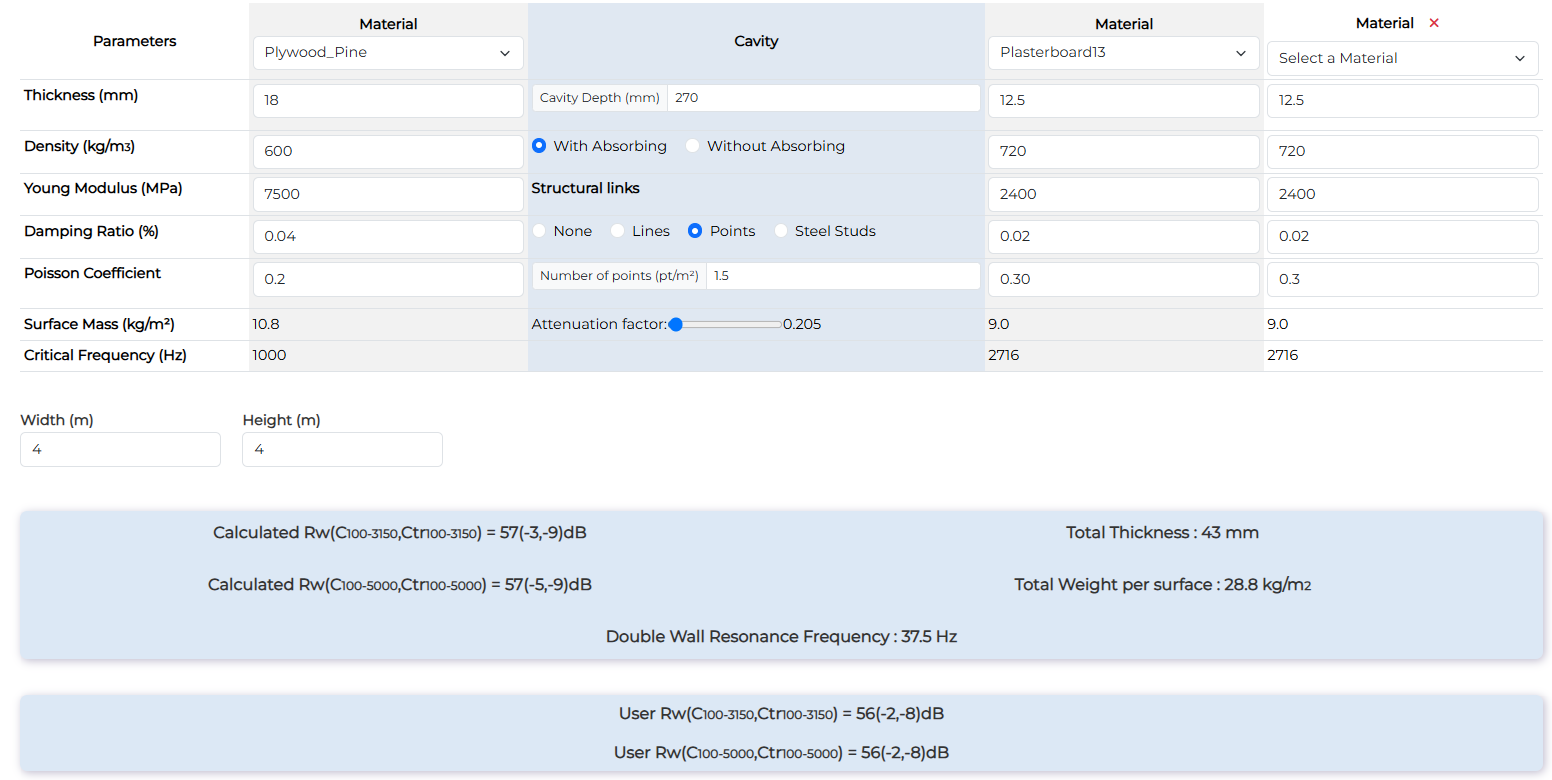
| Wood floor with ceiling + 2 plasterboard 13mm | Rw (dB) | Rw+C (dB) | Rw+Ctr (dB) |
| Measurement | 56 | 54 | 48 |
| Calculation with points | 57 | 54 | 48 |
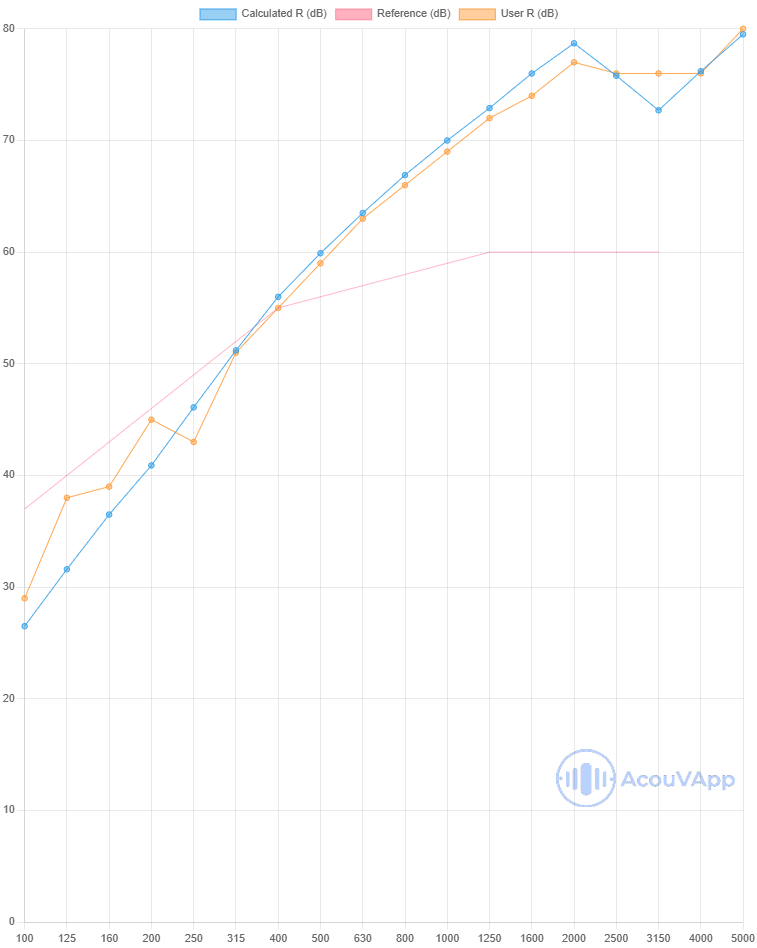
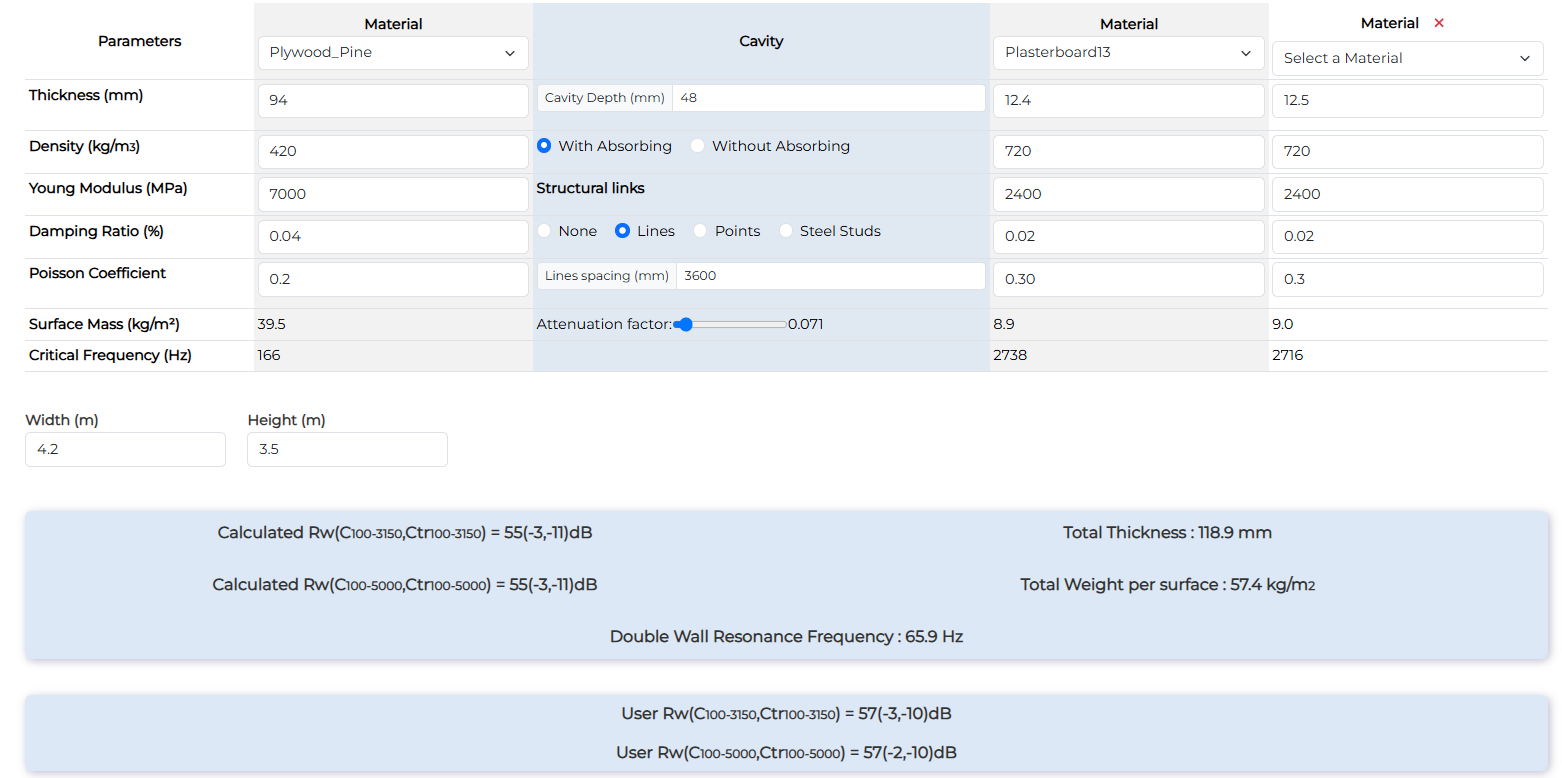
Timber 94mm with 2 x Plasterboard13 - 45mm glass wool - Metal studs 48mm
| Wood floor with ceiling + 2 plasterboard 13mm | Rw (dB) | Rw+C (dB) | Rw+Ctr (dB) |
| Measurement | 57 | 54 | 47 |
| Calculation with points | 55 | 52 | 44 |
Some dips appear in low frequency. This type of wood panel has often a orthoptropic behaviour that add more critical frequcies.
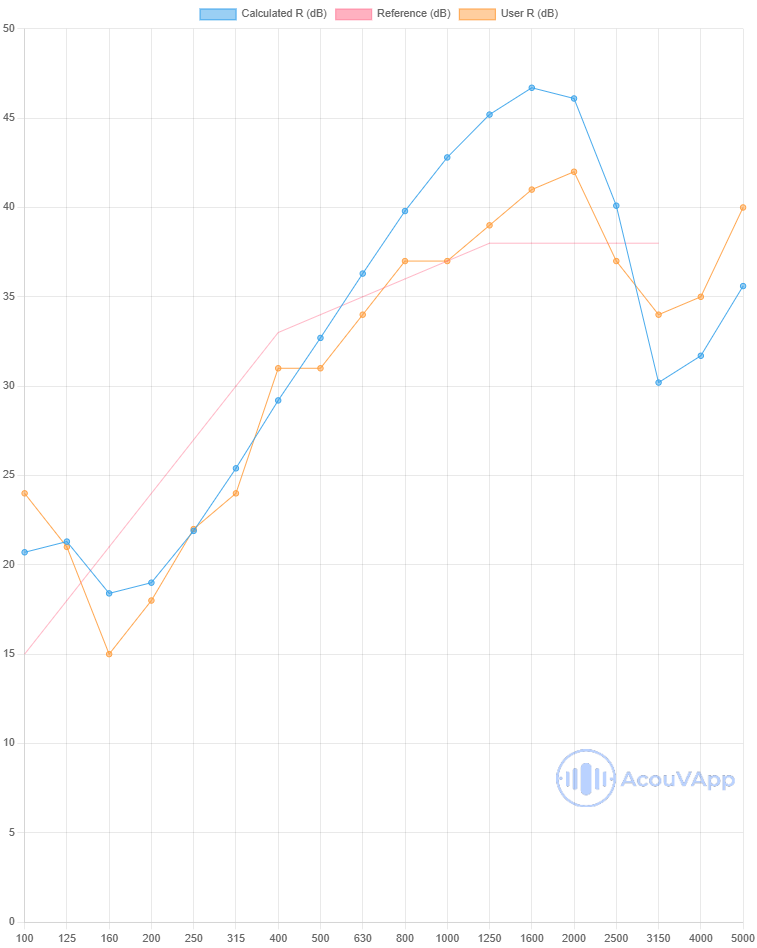
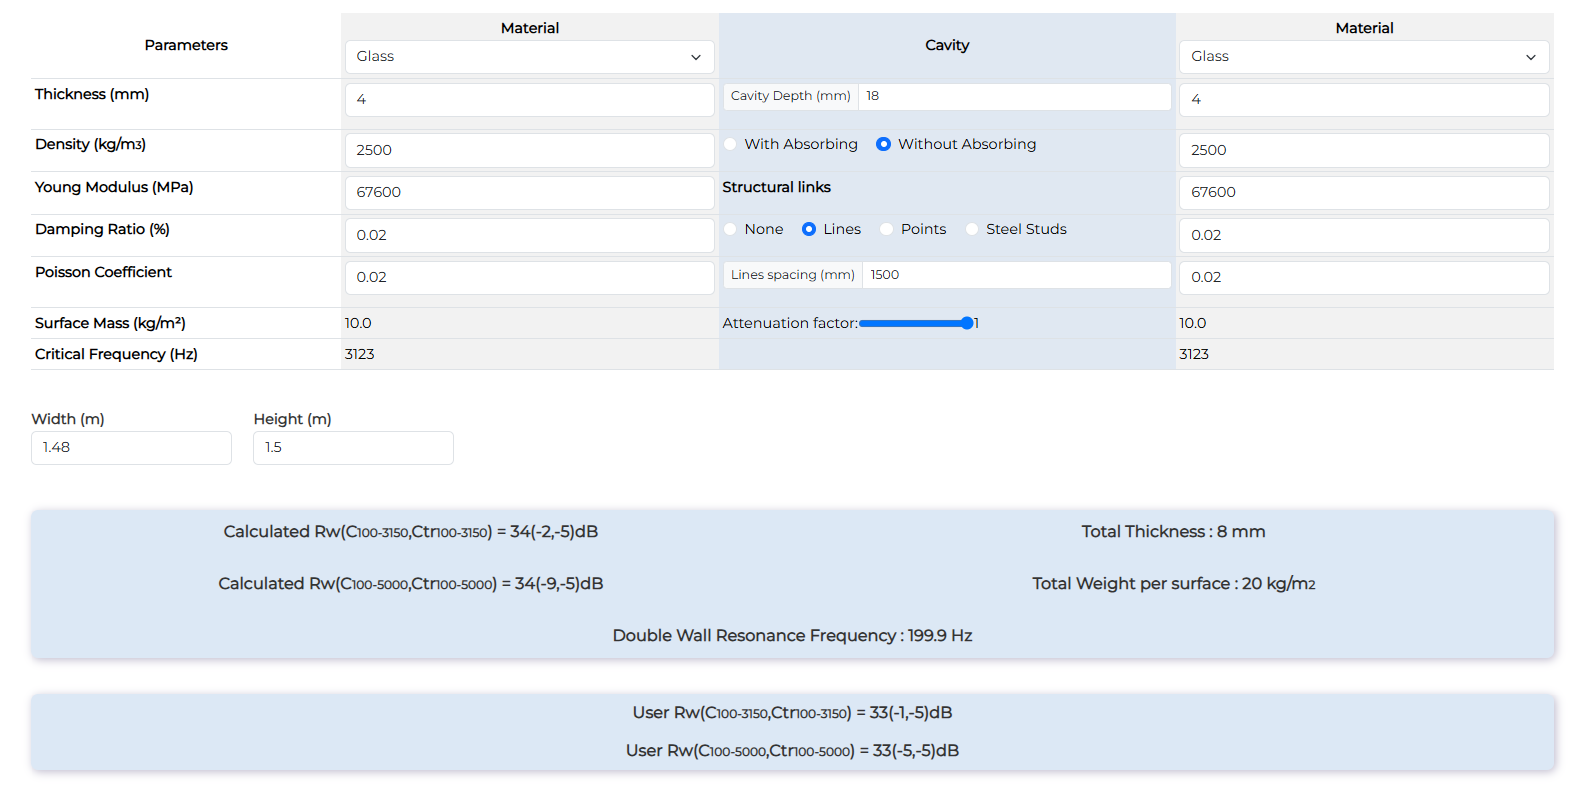
Window 4-18-4 - PVC frame
| Window 4-18-4 - PVC frame | Rw (dB) | Rw+C (dB) | Rw+Ctr (dB) |
| Measurement | 34 | 32 | 29 |
| Calculation with lines | 33 | 32 | 28 |
The global value and shape of the curve is quite representative of the realities. However, In high frequencies, there are some differences due to probably to the framecontribution (the model is not taken into account complex frame) and also the absorption in the cavity depth (no absorption but the behaviour in the border is complicated).
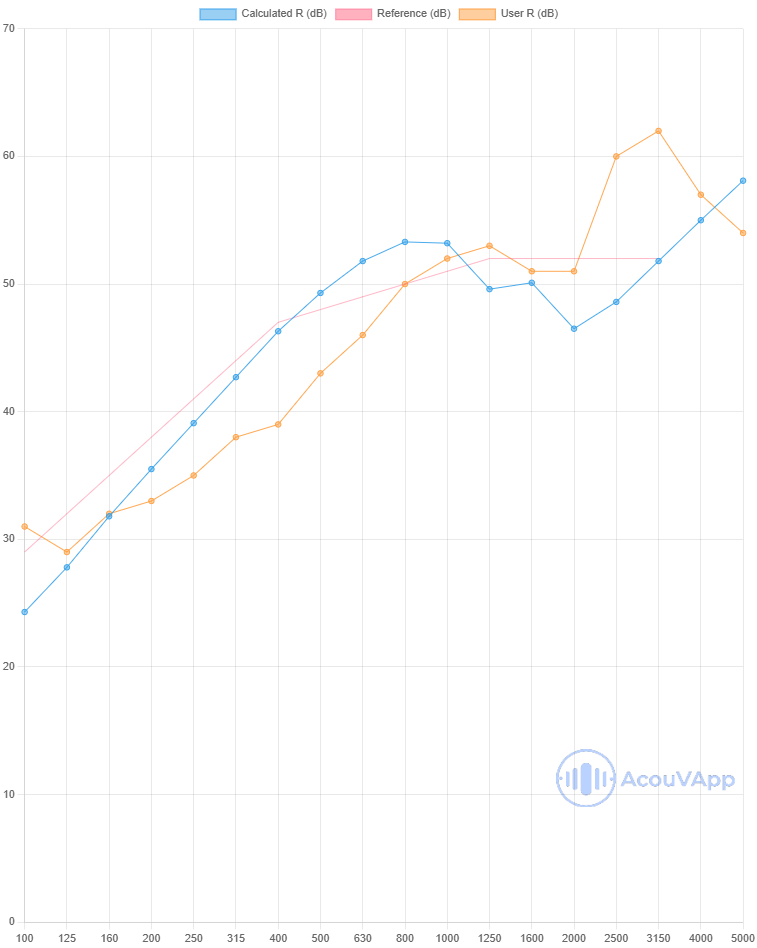
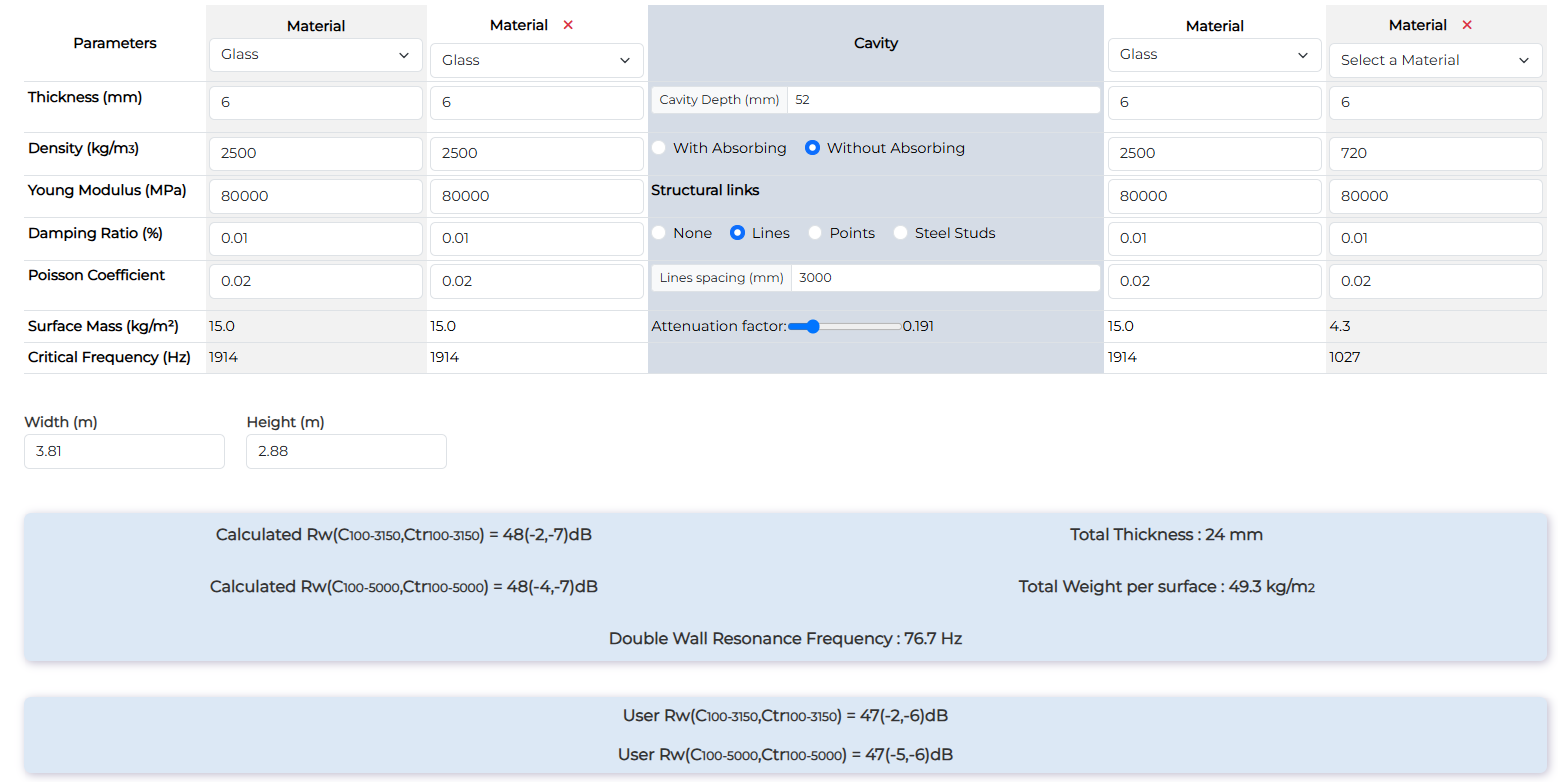
Fixed Window 66-52-66 (3.8m * 2.8) - Aluminium frame
| Window 4-18-4 - PVC frame | Rw (dB) | Rw+C (dB) | Rw+Ctr (dB) |
| Measurement | 47 | 45 | 41 |
| Calculation with lines | 48 | 46 | 41 |
The global value and shape of the curve is quite representative of the reality. However, In high frequencies, there are some differences due to probably to the frame contribution (the model is not taken into account complex frame) and also the absorption in the cavity depth (no absorption but the behaviour in the border is complicated). The damping and youg modulus is not well known too.
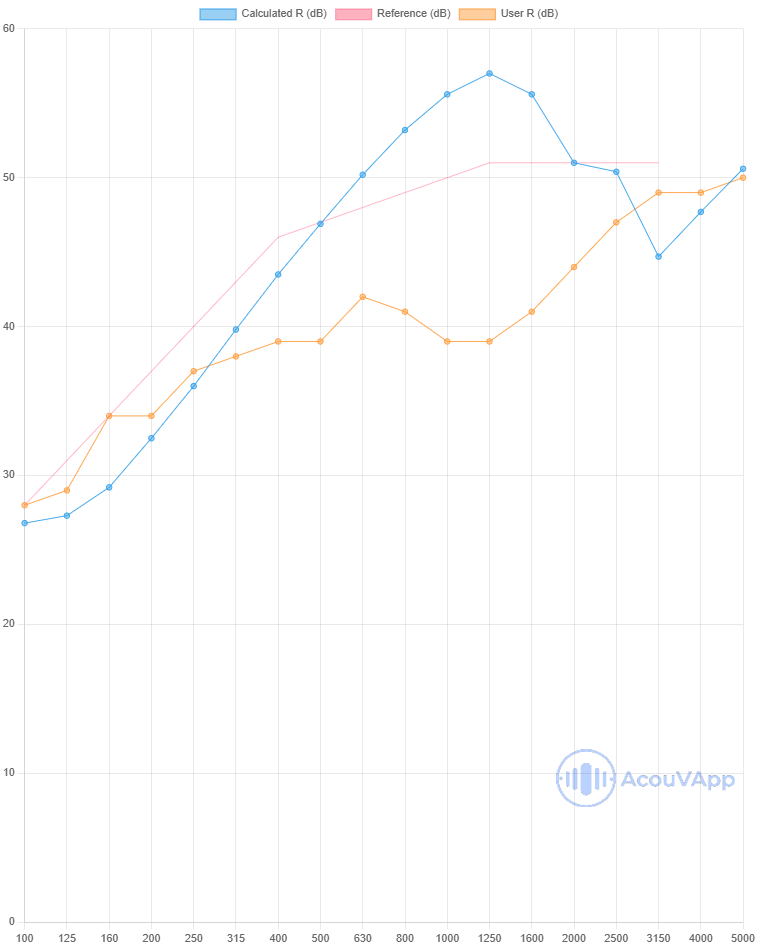
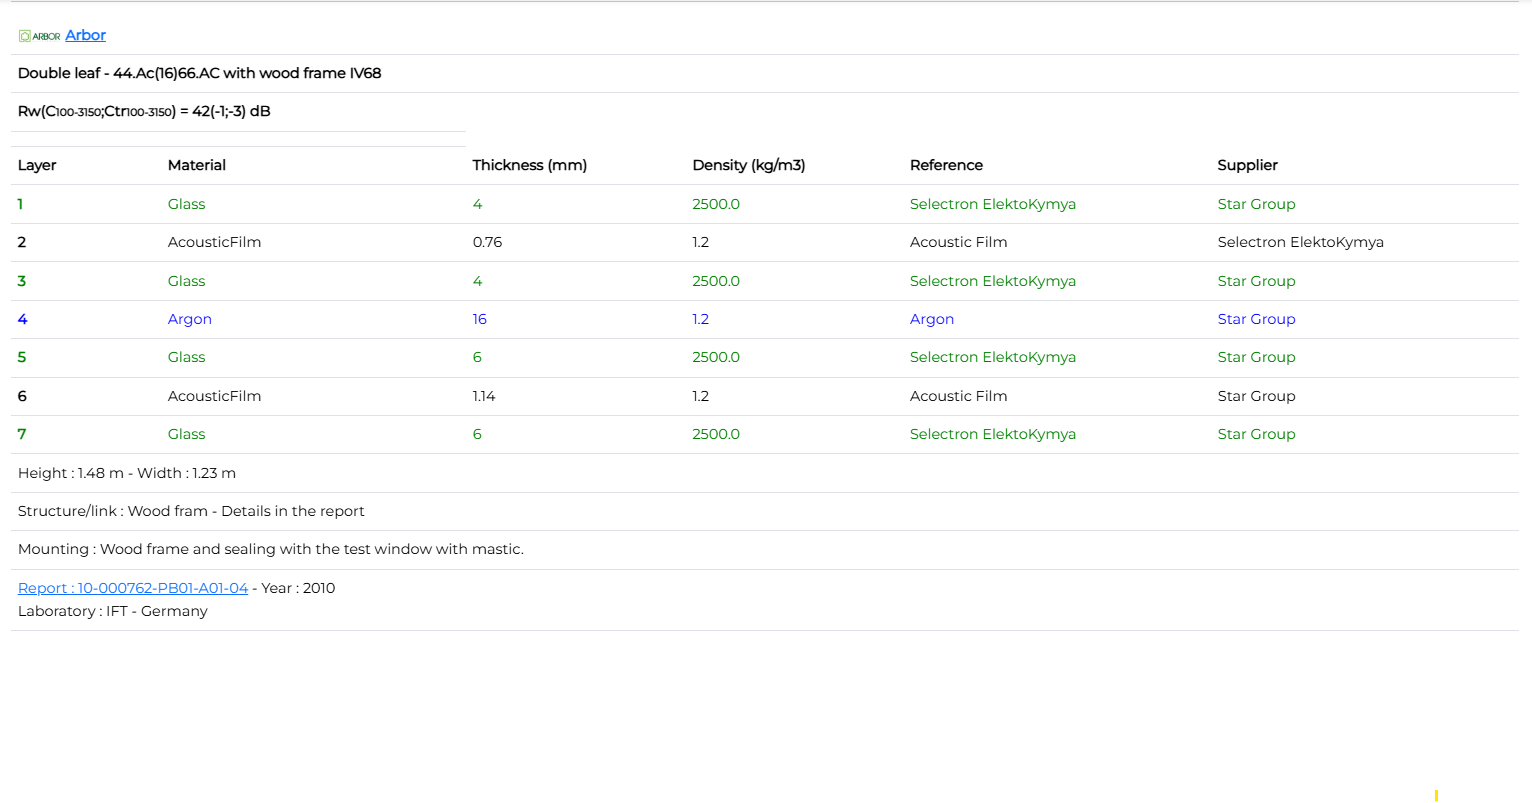
Window 44.Ac(16)66.AC with wood frame
| Window 44.Ac(16)66.AC with wood frame | Rw (dB) | Rw+C (dB) | Rw+Ctr (dB) td> |
| Measurement | 42 | 41 | 39 |
| Calculation with lines | 47 | 45 | 40 |
Even if the low frequencies (and final Rw+Ctr) are comparable to the measurement, important differences are present in mid-high frequencies. The wood frame contribution should be an explanation and more compliance value for this kind of structure could help to have better data.
References
[1] Davy - 2009a - Predicting the Sound Insulation of Walls
[2] Sharp - 1978 - Prediction Methods for the Sound Transmission of Building Elements
[3] Kosala - 2018 - Calculation models for analysing the sound insulating properties of homogeneous single baffles used in vibroacoustic protection
[4] Mansilla - 2022 - Sound insulation prediction method for single and spot laminated multilayer panels
[5] Hopkins - 2005 - Sound Insulation
[6] Davy - 2009 - The improvement of a simple theoretical model for the prediction of the sound insulation of double leaf walls.
[7] Davy - Santoni - 2020 - A review of the different approaches to predict the sound transmission loss of building partitions.
[8] Hongisto - 2006 - Sound Insulation of Double Panels - Comparison of Existing Prediction Models
[9] - Tsay - Lin- 2021 - Parameter analysis and modification of transmission loss models for multi-layered cavity walls
[10] - Mansilla - 2022 - Sound insulation prediction method for single and spot laminated multilayer panels
[12] - JG Rindel - Sound Insualtion in Buildings
[13] - Hirakawa-Davy - 2015 - The equivalent translational compliance of steel or wood studs and resilient channel bars
[14] - Davy, Fard, Dong, Loverde - 2018 - The equivalent translational compliance of steel studs with different steel gauge thicknesses
[15] - Davy, J - 2012 - Sound Transmission of cavity walls due to structure borne transmission via point and line connections
[16] - Davy, Guigou, Villot - The equivalent translational stiffness of steel studs
[17] - Davy - 2019 - Structural connections and the sound insulation of cavity walls


