Introduction to Acoustic Weighting
Acoustic weighting is a critical concept in the field of audio engineering and acoustics,
playing a pivotal role in how we measure, analyze, and understand sound.
It involves applying a specific filter to sound measurements to account for the frequency sensitivity
of the human ear.
Among the various weighting scales, A-weighting and C-weighting are the most prominently used.
This article aims to unravel the complexities behind these weightings, shedding light on their historical
development, technical underpinnings, and practical applications.
The Origins of Acoustic Weighting
The concept of acoustic weighting emerged in the early 20th century as researchers began to
understand that the human ear does not perceive all frequencies equally especially with the study of the loudness.
Lot of tests have been done to evaluate the human sensitivity at different frequencies and sound levels. The results are the curves presented in the graph below.
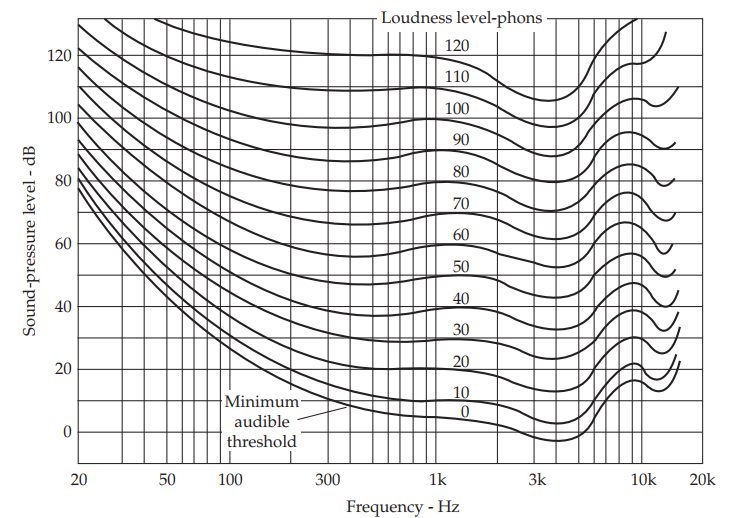
The A network is an inversion of the 40-phon hearing response,
the B network is an inversion of 70-phon response, and
the C network is an inversion of 100-phon response [3]
This realization was crucial in developing methods to accurately measure sound
in a way that reflects its true impact on human hearing.
A-Weighting: A Historical Perspective
A-weighting, the most commonly used acoustic weighting filter,
was developed in the 1930s.
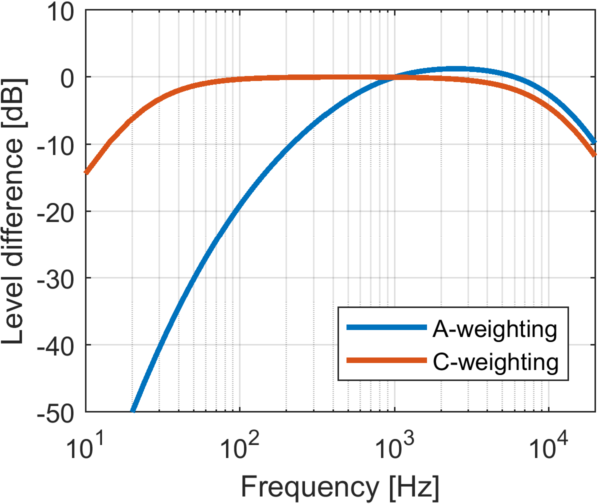
It was designed to mimic the frequency sensitivity of the human ear at lower sound levels, typical of quiet environments (<55dB).
The A-weighting curve significantly attenuates frequencies below 1 kHz and above 6 kHz,
closely matching the ear's response to soft sounds.
C-Weighting: Addressing Louder Environments
C-weighting, on the other hand, was developed to provide a more accurate representation of
sound as perceived by the human ear at higher sound levels (more than 85dB [2]).
Unlike A-weighting, the C-weighting curve is almost flat in the midrange frequencies, with only slight
attenuation at the very low and high ends of the frequency spectrum.
This makes it more suited for measuring sound levels in louder environments.
The Technical Aspects of Acoustic Weighting
Acoustic weighting has a wide array of applications in the field of engineering and beyond.
-
A-weighting is extensively used in environmental noise measurement, workplace noise assessments,
and in the design of consumer electronics to ensure sound quality and compliance with noise regulations.
- C-weighting finds its application in measuring the performance of audio equipment, concert noise levels, and in the assessment of industrial noise where higher sound levels prevail.
Both A-weighting and C-weighting are defined by specific mathematical curves that adjust
the amplitude of sound measurements at different frequencies. These curves are defined by international
standards (e.g., [1] - IEC 61672-1:2013) and can be applied through digital signal processing techniques or analog
filters in sound level meters.
Other weightings exist like the B (medium sound levels) and D-weighting (aircraft noise) but are not uses that much contrary to the A and C.
The Current Relevance and Future of Acoustic Weighting
With the increasing focus on noise pollution and its effects on health,
the role of acoustic weighting in engineering and environmental management has never been more critical.
Advances in digital signal processing have made it possible to apply these weightings more accurately and in real-time,
expanding their applicability.
Moreover, research into human auditory perception continues to refine our understanding of
how sound is experienced, potentially leading to the development of new weighting curves that could offer even more precise
measurements in the future. The increasing of psychoacoustic studies is one proof of this evolution.
Conclusion
The development and application of A-weighting and C-weighting reflect the ongoing efforts to understand
and measure sound in a manner that mirrors the human experience.
These tools are indispensable in the engineer's
toolkit, bridging the gap between raw sound data and our subjective auditory perception. As we move forward,
the evolution of acoustic weighting will continue to play a crucial role in mitigating noise pollution,
enhancing audio technology, and protecting hearing health, marking its enduring significance in both
engineering and the broader scientific community.
Of course, these weightings are not the only ones to quantify the perception of sound by human. A scientific field specific to the perception of sound, psycho-acoustic
study lot of quantities to try to understand how sounds are perceived by humans. Perhaps more details in a next article
References
- [1] - IEC 61672-1:2013 : Electroacoustics - Sound level meters - Part 1: Specifications
- [2] -BIes - Engineering Noise Control Theory and Practice
- [3] - Everest, F.A. & Pohlmann, K.C. - Master Handbook of Acoustics - 5th ed
Try VAPP Acoustic to calculate the weighting curve
Acoustic Weighting Calculation